The graph is an onboarding map, not an architecture oracle
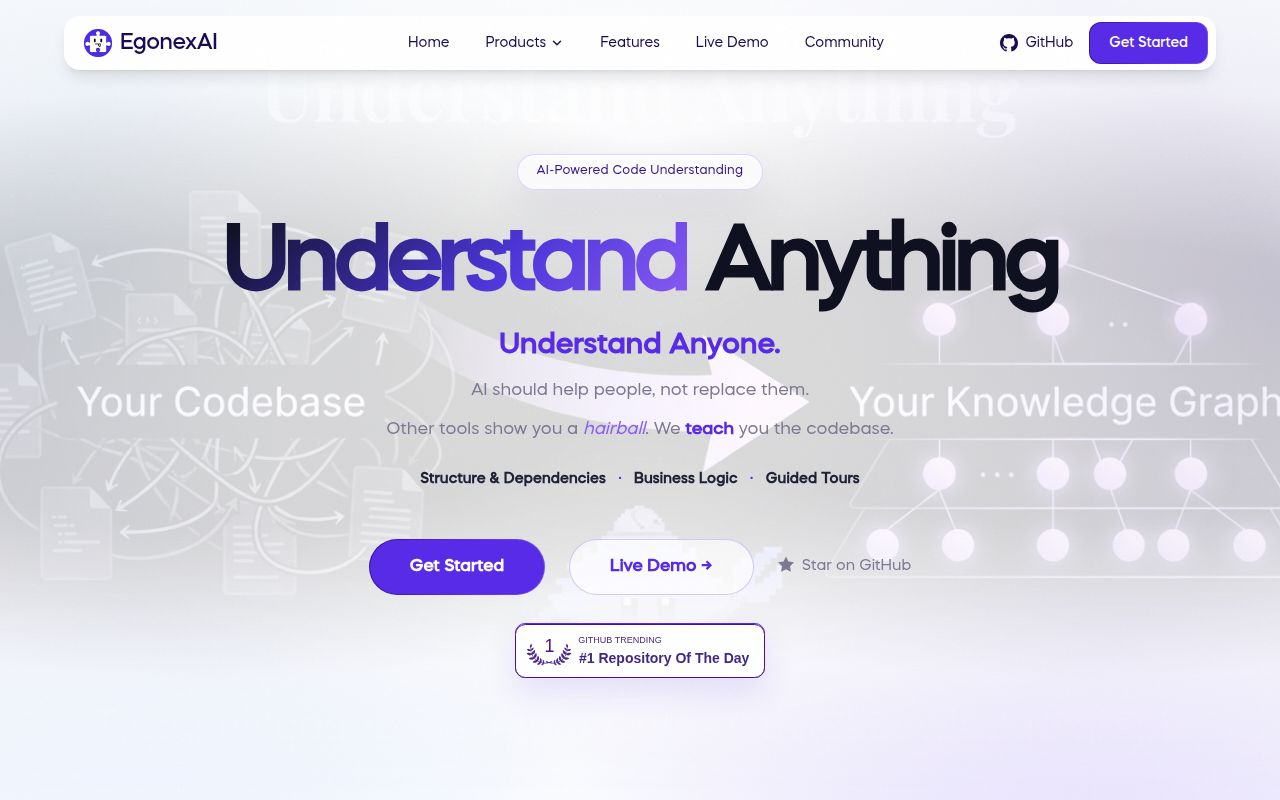
Understand Anything scans files, extracts structural facts, asks language models for meaning, and writes a knowledge graph to .ua/knowledge-graph.json. The dashboard turns that data into searchable nodes, relationships, layer views, guided tours, and business flows. A developer can ask how authentication works, inspect the affected area of a diff, or generate an onboarding route without starting from a blank repository tree.
The split between Tree-sitter and LLM work is sensible. Parsers handle imports, declarations, call sites, and inheritance, while models write summaries and infer intent. Structural extraction can be repeated from the same source; semantic descriptions can vary with model and prompt. Readers should click through to the underlying files before acting on a surprising edge or business claim. The graph shortens exploration, but source code remains the evidence.
Five core agents make the first scan expensive
The main command coordinates 5 agents for scanning, file analysis, architecture, tours, and review. Domain analysis adds a 6th, and knowledge-base analysis adds a 7th. File analyzers can run with up to 5 workers, processing batches of 20 to 30 files. That parallel design suits large repositories, but each semantic batch can consume model tokens.
The README warns that the initial full analysis may use a significant amount and recommends a subscription plan or local model. Issue 657 says the project has no published end-to-end token or cost measurement for a real run. Its existing large-repository benchmark intentionally excludes LLM calls and token estimates. Budget-sensitive teams therefore need a small pilot on representative directories before pointing the tool at 200,000 lines.
What happened when we ran it
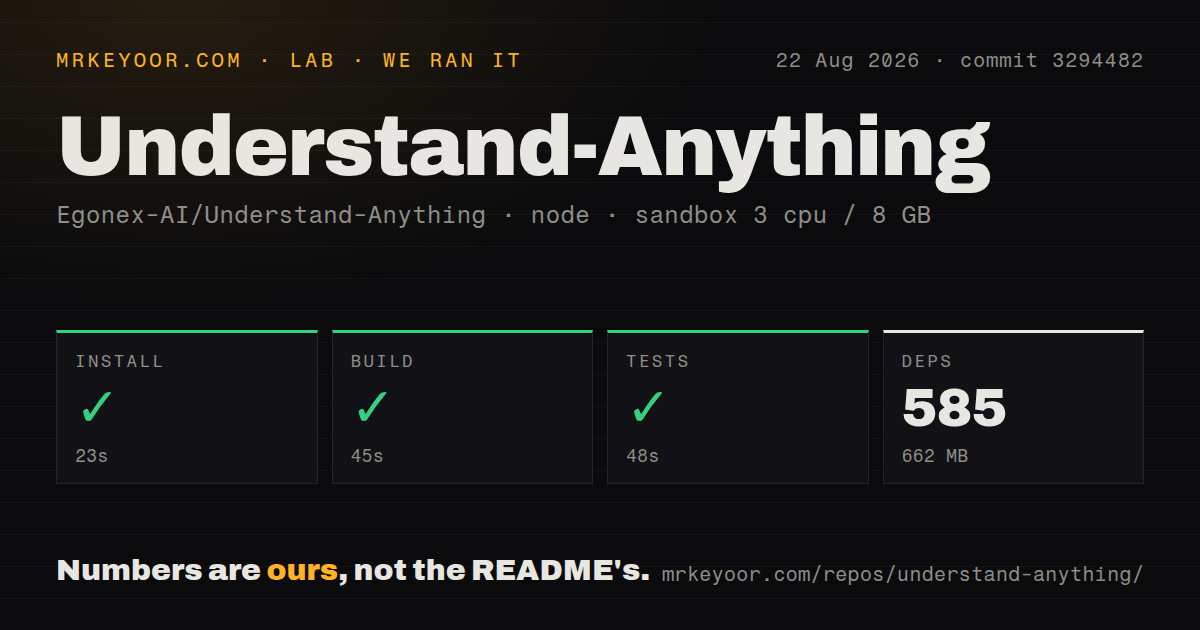
Our sandbox installed 585 pnpm packages in 23 seconds and used 662 MB on disk. The monorepo build succeeded in 45 seconds, and tests succeeded in 48 seconds. We ran commit 3294482 in an unprivileged Debian container with 3 CPUs and 8 GB of RAM. The checkout contained 499 files, about 68,543 lines of source, and occupied 32.7 MB.
The repository had 2 CI workflow files, a tests directory, and no Dockerfile. All three measured steps completed successfully, unlike the other repositories in this assigned batch. Those results cover project mechanics, not graph accuracy on an outside codebase. We did not run a paid model over a large repository, measure token consumption, or compare generated edges against a hand-built architecture map.
A 662 MB dependency installation is heavier than the 32.7 MB checkout, though still manageable on a developer machine. The successful build and test run justify trying the tool. They do not answer how a chosen model behaves on uncommon languages, how long a full semantic pass takes, or how much it costs. Those questions need a repository-specific evaluation.
Silent relationship errors are the main risk
Several open reports describe output that remains schema-valid while losing meaning. Issue 653 shows documented_by normalized to documents without swapping endpoints, which reverses the relationship. Issue 620 says a regular expression can damage TypeScript path aliases containing /*, leaving many aliased imports unresolved. Issue 615 reports missing CommonJS imports and exports.
Language-specific edges need similar care. Issue 645 says C# namespace imports are treated as file paths, and issue 646 reports that missing test-name patterns can drop Swift, Rust, Ruby, and PHP test relationships. Issue 590 describes newly added imports missing from incremental updates until a full scan. For a polyglot codebase, sample each major language, inspect high-degree nodes, and compare a few import plus test edges with the compiler or repository search.
A committed graph saves tokens and creates review work
The README encourages teams to commit generated .ua data so colleagues can open the dashboard without rerunning the model pipeline. Intermediate files and the diff overlay stay local, while graphs larger than 10 MB can use Git LFS. The standalone viewer requires Node.js 18 or newer and serves the graph from local disk without sending data to a model.
That is useful for onboarding, but a committed derived artifact can drift. The optional post-commit hook runs incremental updates, which adds automation and another place to verify issue 590's import behavior. Treat graph changes like generated documentation: review unusual removals, regenerate fully after parser upgrades, and tie the artifact to the commit it describes. A stale confident summary can mislead a new teammate more effectively than no summary.
July's release expanded scope while August issues found gaps
GitHub showed 80,653 stars and 290 combined issues and pull requests when fetched. The last push was August 26, 2026. Release v2.9.0 arrived July 10 with Figma graphs, the .ua directory, added language support, merge warnings, security hardening, and pipeline changes. The source has continued moving since that release, including reports against plugin 2.9.4.
The activity is healthy and the issue queue contains unusually detailed reproductions. It also shows a young system expanding across many languages, agents, and graph types. Understand Anything is a good second pair of eyes for codebase orientation, and its clean 23-second install plus passing build and tests lower the trial cost. Keep it advisory, measure token use on your repository, and verify the graph paths that will influence design or review decisions.