Telegraf collects on one interval and sends on another
Telegraf's README describes an agent that collects from inputs at collection intervals and sends to outputs at flush intervals. If the destination stops accepting data, the buffer settings determine how much unwritten data the agent can retain.
Telegraf is worth evaluating when a fleet needs several kinds of collection through the same agent. Its README lists system metrics, message systems and industrial protocols, including MQTT and Modbus. Check whether your particular plugins and delivery requirements fit. A catalog entry is a starting point for qualification, not proof that the entire route works in your environment.
What happened when we ran it
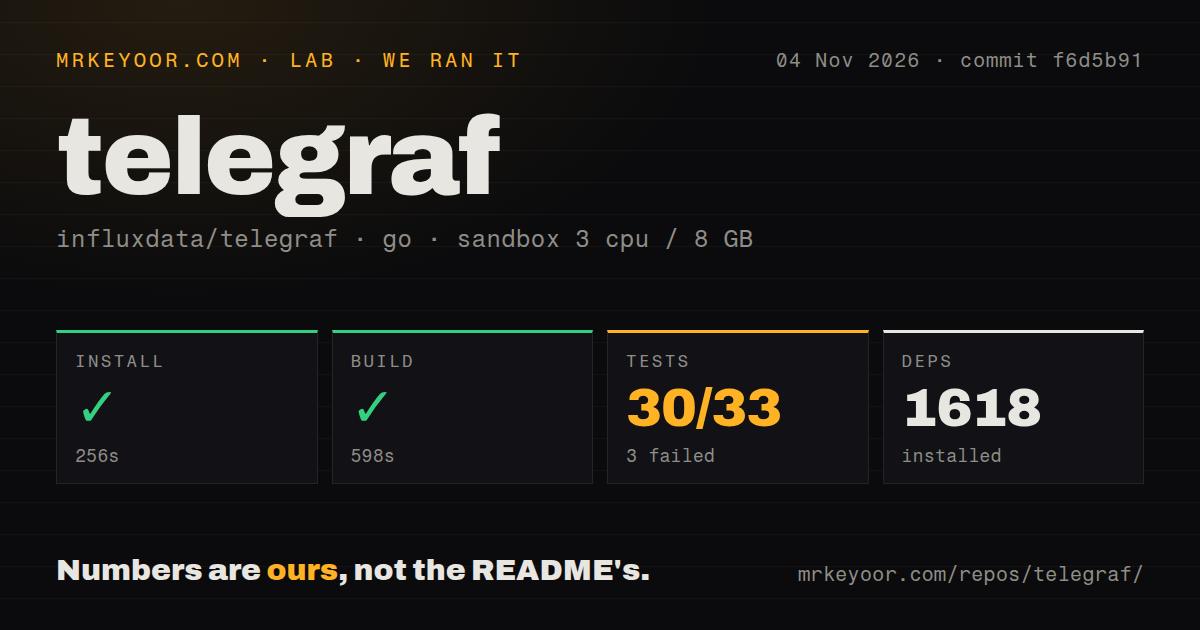
Our Telegraf sandbox installed dependencies in 256 seconds and built the repository in 598 seconds at commit f6d5b91 on November 4, 2026. The record lists 1,618 dependencies. The test command failed with exit 1 after 590 seconds, with a recorded Go summary of 30 passed and 3 failed of 33.
The supplied tail marks the prometheusremotewrite serializer package as failing. It also names TestEmptyContainerIntegration under testutil. Other package lines report success before the final FAIL. Those lines establish that the command failed and identify places to investigate. They don't show the failed assertions, identify every failure in the summary or establish the underlying causes.
The integration check's name doesn't establish why it failed. The serializer failure also doesn't establish that deployed Prometheus remote write is broken. Diagnosing either failure requires the missing assertions and a matching reproduction.
Our checkout contained 6,433 files, approximately 528,679 source lines and 26.5 MB. The scan recorded five CI workflow files, no Dockerfile and no tests directory. The actual test step still ran. The configured sandbox had 3 CPUs, 8 GB RAM and image label golang:1.24-bookworm, without raw toolchain evidence establishing the runtime versions.
The TOML file defines the deployment you need to qualify
The configuration guide separates global tags, agent settings and plugins. It documents generating a configuration filtered to chosen inputs and outputs. Start an evaluation with a small route so you can check which component produced each measurement and where it went.
Each plugin has its own options, and plugin instances can have different configurations within the same process. This allows similar sources to use different credentials or collection schedules. Read the selected plugins' instructions before treating them as a replacement for an existing collector.
Credentials depend on the services you connect. The guide supports environment-variable substitution and secret-store references. It also describes the memory-locking requirement when using plugins supporting secrets. Plan those settings with the service account and host restrictions you will use. Our source run did not verify a credentialed output or delivery to a destination.
A full buffer can overwrite older metrics
The configuration guide says metric_buffer_limit sets the maximum number of unwritten metrics per output. Increasing it allows a longer destination outage at the cost of higher maximum memory use. When the buffer fills, newer metrics replace older ones. That rules out relying on default buffering for unconditional retention through an outage.
Disk-backed buffering is documented, but the guide labels it experimental. Its sync setting also has a durability tradeoff: disabling sync risks losing metrics buffered in the last flush interval during a power cut. Evaluate the failure cases you need to survive. We did not measure loss, recovery time or memory under a stalled output, so this run cannot establish a safe outage duration.
The guide also documents a platform caveat: PowerShell 5 defaults to UTF-16LE, while Telegraf expects UTF-8 configuration files. Follow its encoding instructions when generating configuration through PowerShell 5. This is a documented setup caveat, not a problem observed in our sandbox.
Release notes don't explain our failed command
Telegraf v1.40.3 is dated November 2, 2026 and lists fixes across inputs, outputs and serializers. The issue list includes requests opened in late October and early November. These are signs of recent project activity; they don't establish support quality or deployment reliability.
A serializer fix in release notes doesn't establish the cause of our serializer failure. The record does not connect the failing assertion at f6d5b91 to that release change. The sandbox result applies to the recorded commit and should not be presented as a test of the v1.40.3 release. Numerical ratings remain unassessed because these checks don't establish deployment reliability or support capacity.
A host exporter may cover the narrower job
Prometheus Node Exporter exposes hardware and OS metrics from *NIX kernels. Choose it when that host-level scope matches the need. Its README recommends Windows exporter for Windows users and cautions that container deployment needs access to the host to avoid observing only the container.
Fluent Bit collects, processes and forwards logs, metrics and traces through plugins. Evaluate it when forwarding telemetry is the main job and its plugins fit the required sources and destinations. This record contains no comparison of its resource use or delivery behavior with Telegraf.
For a Telegraf trial, select one required input and its intended output, then interrupt the destination deliberately. Check what arrives after recovery against what was collected, including timestamps and missing samples. This is a proposed qualification step, not a test performed in the supplied run. Decide whether the observed behavior meets your retention requirement before adding the rest of the fleet.