OpenStatus joins the monitor to the message
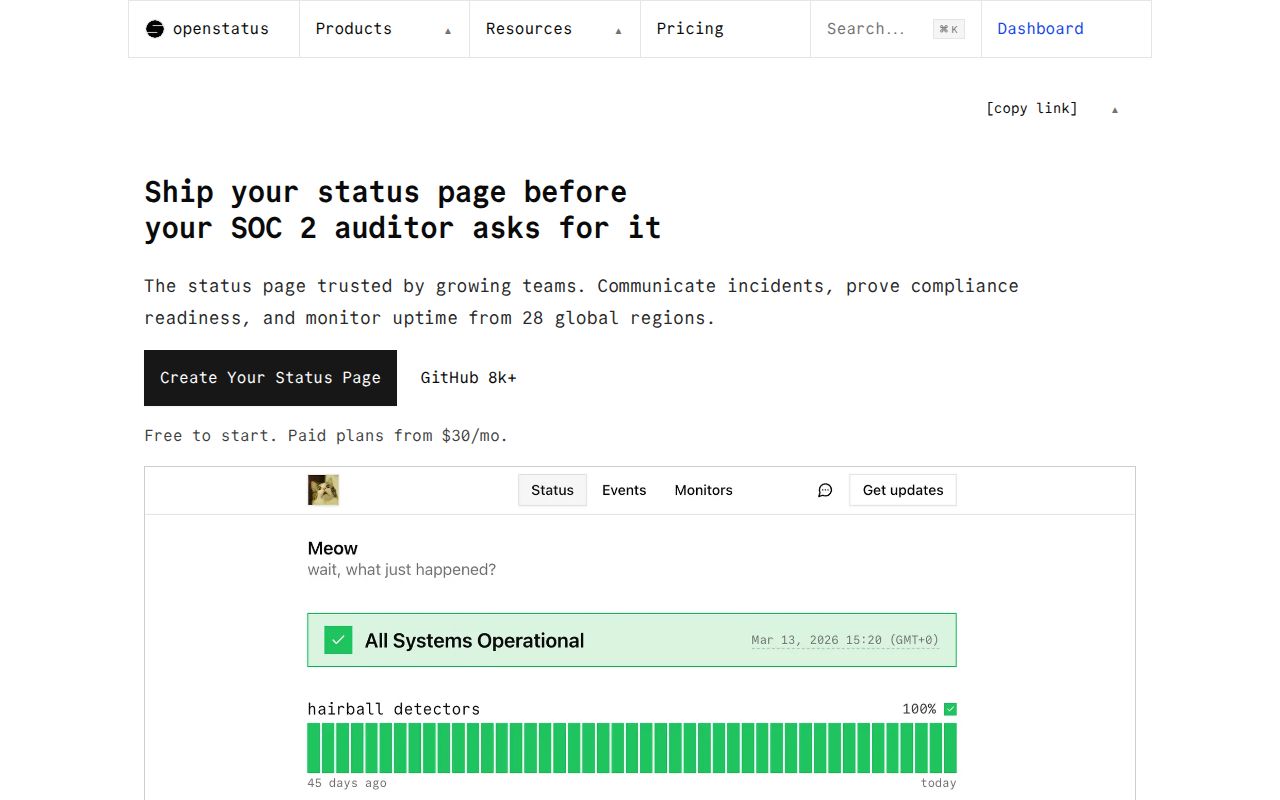
OpenStatus checks websites, servers, and APIs, then publishes the same operational state through branded status pages. That pairing removes a common gap between detecting an outage and telling customers what happened. Pages support custom domains, maintenance windows, password protection, and subscriber updates. Monitors can notify Slack, Discord, PagerDuty, email, and other channels. The project is available as a hosted service or as AGPL-3.0 software for teams willing to operate it.
The managed platform advertises checks from 28 regions across 3 cloud providers. Those figures describe the hosted offering, not a promise for a local installation. A self-hoster gets private-location agents and can place them where useful, but must supply the machines and network paths. Issue 2056 asks for easier automation and richer location properties for fleets of private probes. That matters if private locations are meant to be reproducible infrastructure rather than entries created by hand.
The API supports humans, automation, and MCP clients
The dashboard is only one control surface. OpenStatus exposes a typed HTTP API, a Node SDK, an interactive CLI with JSON output, a Terraform provider, and YAML monitoring files. Its MCP server lets compatible assistants work against the same workspace through the same API key. This is a good fit for an operations team that wants a monitor created in Terraform, inspected in a terminal, and queried from an agent without maintaining separate records.
Shared credentials also deserve careful boundaries. A personal AI client does not automatically need the same write authority as CI or an incident responder. The README says the tooling shares a single API key, so teams should inspect the available scopes and deployment policy before connecting MCP. The useful part is consistent state, not giving every interface unrestricted access. OpenStatus is an operations system, and a mistaken monitor change can affect alerts and public communication.
What happened when we ran it
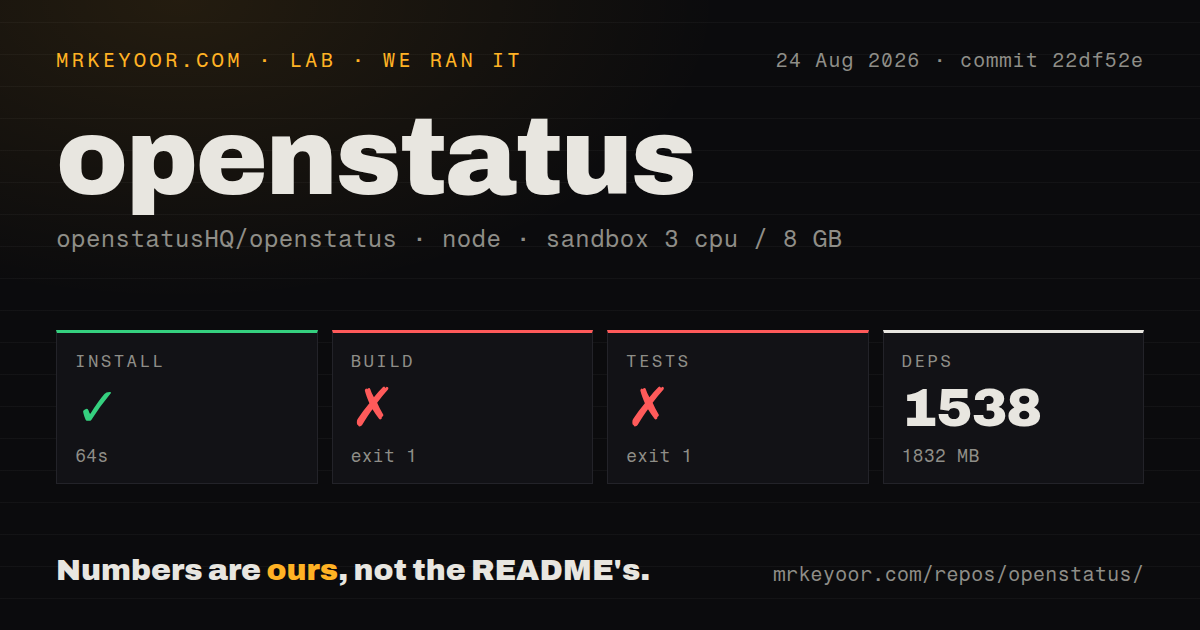
Our fresh Node 22 sandbox completed pnpm install in 64 seconds. It installed 1,538 packages and consumed 1,832 MB, far larger than the 120.5 MB checkout. The monorepo contained 3,791 files and about 300,147 source lines. It had 21 CI workflow files and workspaces across applications, packages, and notification integrations. This is a substantial development environment even before databases and runtime services enter the picture.
The root build failed after 6 seconds. Turbo reached the @openstatus/proto package, where buf generate reported that buf.gen.yaml did not exist. The summary showed 1 successful task out of 3 and identified proto as the failed package. The log supports that exact finding only. It does not show whether the file should be generated, copied from elsewhere, or supplied through a different documented command.
The test run failed after 7 seconds. Turbo scheduled 30 tasks, reported 0 successful, and named @openstatus/notification-opsgenie as the failed package. The supplied tail ends with lifecycle failure messages and omits the underlying test error. We cannot label this an Opsgenie credential problem or a broken assertion without evidence. What a contributor can rely on is simpler: the root build and root test did not pass on the supplied commit in our unprivileged container.
Docker starts at least 7 moving parts
The recommended local path copies .env.docker.example, starts Compose, applies database migrations, and exposes the dashboard on port 3002 plus status pages on 3003. The service table lists a migration job, workflows, API server, dashboard, status-page server, private-location agent, libSQL database, and optional Tinybird analytics. That makes the product easier to start consistently, but it is still a distributed application rather than a single uptime daemon.
Required configuration includes AUTH_SECRET, DATABASE_URL, DATABASE_AUTH_TOKEN, and an email provider value. Magic-link login is available for self-hosting; GitHub and Google OAuth need their own client credentials and callback URLs. Tinybird enables analytics, while Redis-backed services and notification channels add more keys. Production operators also need public DNS, TLS, backups, mail delivery, and an upgrade procedure that preserves the libSQL data and applies migrations safely.
Self-hosted edges still show in current issues
Open issue 2573 says the Test Monitor button may fail when a self-hosted instance lacks a reachable hosted checker. The reporter also reached a local checker but received a response that failed schema validation. Issue 1956 documents a different installation repeatedly redirecting an authenticated user to login and returning unauthorized errors during dashboard actions. These are individual reports, not proof that every self-host fails, but both concern basic operator workflows and were still active in August 2026.
Security activity is current too. Issue 2595 described an unauthenticated upload route backed by Vercel Blob; pull request 2601 proposes removing the unused endpoint. Since the report and fix were both open in the fetched data, confirm the route state in the commit you deploy. The repository had 77 issues and pull requests combined, was pushed on August 25, and had no GitHub latest release object. Active code and issue work are healthier signals here than a release tag that does not exist.
Pick it for one operational source of truth
OpenStatus makes the strongest case when a team wants checks, incidents, status pages, code-defined configuration, and agent access to agree on the same records. The Docker documentation is better than the failed contributor commands suggest, and the product exposes more automation paths than many status-page tools. The price is a heavy dependency tree and several runtime services. If you only need a few endpoint checks and a public page, Gatus or Uptime Kuma will be easier to understand and maintain.