One server reaches dashboards, logs, metrics, and incidents
Grafana MCP server gives an MCP client named tools for work that would otherwise require Grafana UI navigation or direct HTTP calls. The catalog includes dashboard lookup and patching, Prometheus and Loki queries, alert rules, incidents, OnCall schedules, annotations, snapshots, rendering, and datasource-specific operations. That breadth is useful during an investigation because the assistant can start with an alert, inspect a panel query, and follow the underlying telemetry without receiving a pasted screen full of JSON.
Breadth also has a context cost. The README warns that a complete dashboard can consume substantial model context and recommends summary or JSONPath property tools instead. Categories can be disabled, while several expensive or sensitive groups are off until added through --enabled-tools. This matters because every default tool definition is sent to the model. A small, job-specific catalog is easier to reason about than granting every operation to every chat.
Grafana 9.0 and a scoped service account are the real prerequisites
The shortest setup uses uvx, a Grafana URL, and a service account token in an MCP client configuration. Binary, Docker, and Helm routes are also documented. Grafana 9.0 or later is required for full functionality because older releases lack datasource API endpoints the server uses. Username and password authentication exists, and multi-organization deployments can supply an organization ID.
Permissions deserve more time than installation. Each tool has Grafana RBAC requirements and may need a resource scope such as datasources:* or dashboards:*. The README suggests the built-in Editor role as a quicker option but accurately calls it less restrictive. That role is a poor default for an assistant that only reads metrics. Create a separate service account, enable only the required categories, and disable write tools unless the use case genuinely needs mutation.
What happened when we ran it
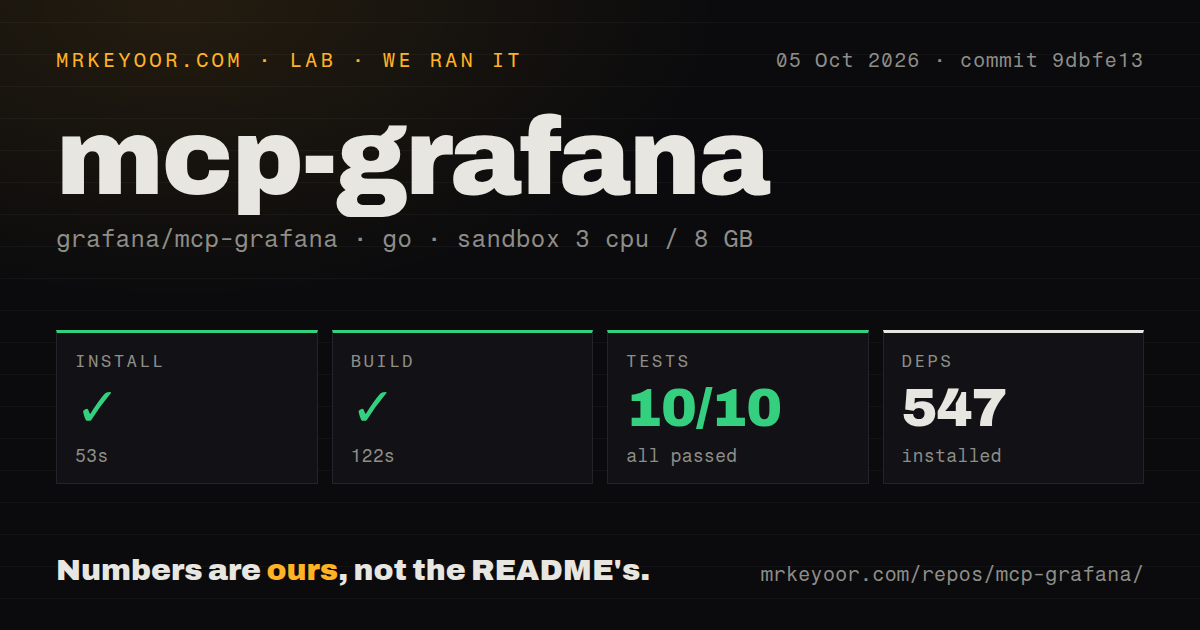
Our sandbox installed 431 Go packages in 114 seconds at commit e959dda. The build completed in another 113 seconds. The test step took 46 seconds and reported 10 passed with 0 failed. Those results came from a fresh unprivileged Debian container with 3 CPUs, 8 GB of RAM, and no secrets.
The checkout contained 445 files, about 87,349 lines of source, and used 4.6 MB before dependencies. It also had 11 CI workflow files, a Dockerfile, and a tests directory. The measured commands establish that the repository installed, compiled, and passed the available Go tests in our environment. They do not establish that a live Grafana API, Cloud feature, datasource plugin, or write action works with your permissions.
The project's own test instructions make that boundary clear. Unit tests need no external dependency, while integration tests expect local containers and broader tests need Grafana on port 3000. Cloud tests require a Grafana Cloud instance and credentials. A team adopting the server should run the tool categories it plans to expose against a disposable Grafana organization before connecting production data.
Network mode needs caller authentication before exposure
Stdio keeps the process attached to one local MCP client and is the safest quick start. The Docker image defaults to SSE, however, and its network modes bind to 0.0.0.0:8000. The README says a server without MCP_GRAFANA_SERVER_TOKEN currently starts while logging a security error, and says a future major release will refuse that configuration. Treat the token as required now.
Streamable HTTP can serve TLS directly with certificate and key flags, or sit behind a trusted proxy. Separate client TLS settings control the connection from this process to Grafana, including custom certificate authorities and mutual TLS. Health checks are available for SSE and streamable HTTP, while Prometheus metrics require a network transport. OpenTelemetry traces and logs can also be exported over OTLP/gRPC.
These choices make the server operable, though they create two credential boundaries: callers authenticate to the MCP server, and the server authenticates to Grafana. A proxy must preserve the intended headers without exposing the Grafana token. The August 25 v1.2.0 release also tightened DNS rebinding behavior, so same-host reverse proxies that preserve a non-loopback Host header may need to rewrite it to localhost.
Product-specific tools make the broad catalog uneven
Core dashboard, Prometheus, and Loki operations fit common Grafana installations. Other entries depend on separate products or plugins. Image output needs Grafana Image Renderer. Snowflake uses Grafana's enterprise datasource plugin. Agent Observability is limited to Grafana Cloud, and Grafana Assistant requires its Cloud plugin. Those are documented limits, but buyers should inventory the exact stack before presenting the catalog to users.
The same caution applies to output sensitivity. Logs, traces, conversations, prompts, and evaluator details may contain personal or confidential data. Open issue 1124 asks for optional PII redaction, which means the server should not be treated as a sanitizing boundary today. Grafana permissions, datasource access, result limits, and the model provider's data policy all remain part of the design.
The August 26 activity supports adoption, with tight permissions
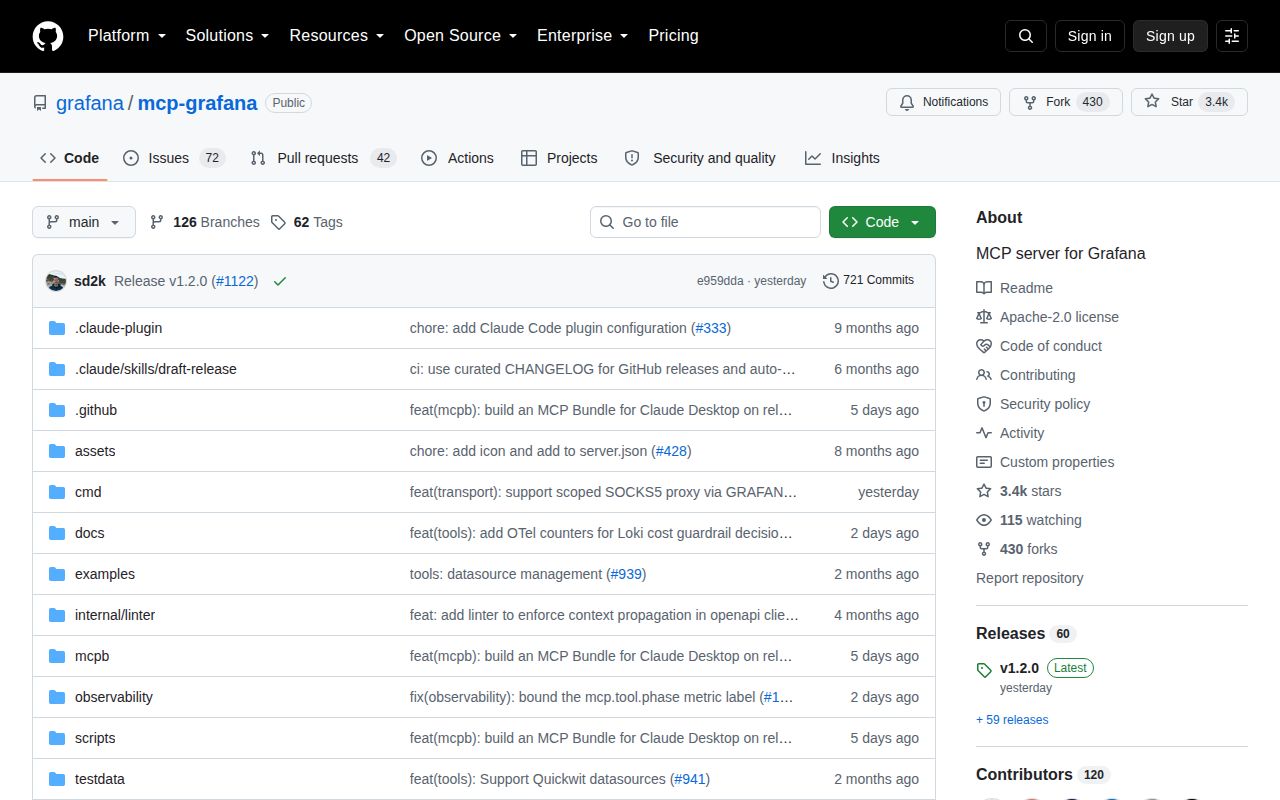
GitHub showed 3,392 stars, 114 combined issues and pull requests, and a last push on August 26, 2026. Release v1.2.0 arrived one day earlier with new alerting and OnCall operations, compact Loki output, a Loki cost guardrail, datasource fixes, proxy fixes, and a Claude Desktop bundle. The close dates and active pull request queue indicate current maintenance.
The server is a strong match for an established Grafana team that already understands RBAC and wants one assistant to cross several observability surfaces. Our 10 passing tests lower the cost of a trial, while the 431-package install and 113-second build show that it is a real Go application rather than a tiny adapter. Start with stdio, read-only access, and a short tool list. Add network transport or mutation only after the credential and audit boundaries are explicit.