A Lighthouse score can move without a code change
Lighthouse's README warns that performance scores vary even when the page code stays the same. That is the detail to settle before wiring its result into a deployment gate. GoogleChrome's Lighthouse opens a page in Chrome and reports on performance, accessibility, SEO and browser best practices. Its report helps you find work to do, but choosing when a change should block release remains your responsibility.
Use Chrome DevTools for a developer's inspection of a page. The CLI adds configurable runs and machine-readable output for automation, while the Node module lets you embed the engine. Those are different entry points to the same diagnostic job. Our recommendation is to adopt it with a repeatable collection process, keeping the page state and browser environment alongside the report.
What happened when we ran it
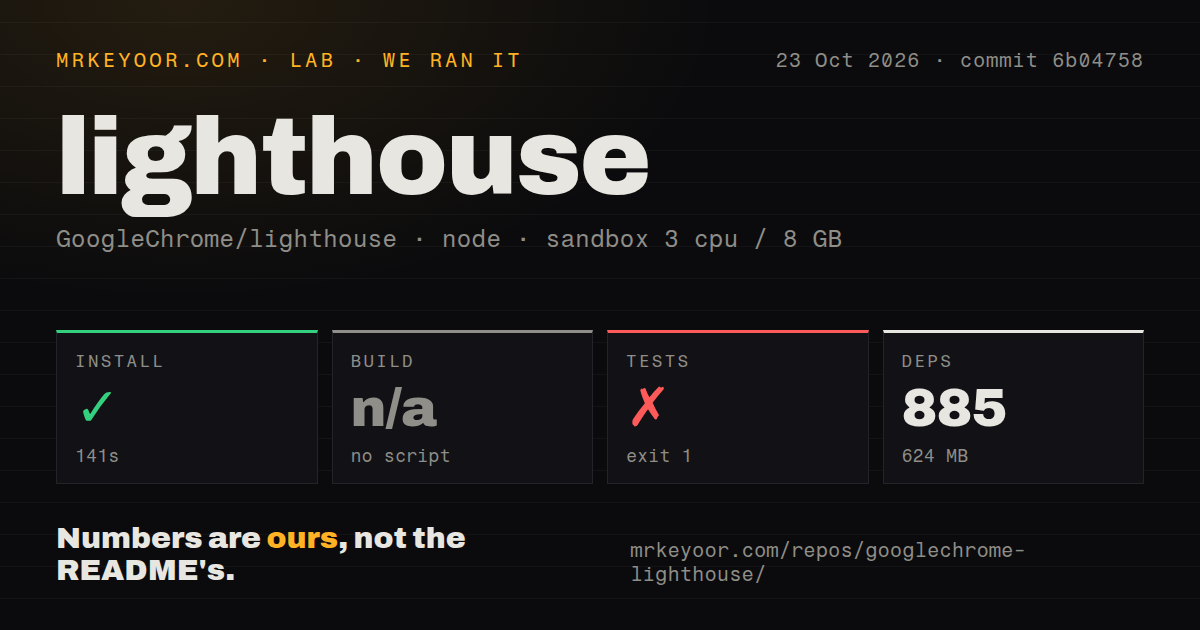
Our Lighthouse run installed 885 dependencies in 141 seconds, used 624 MB, and failed tests in 7 seconds. The test command exited with code 1. The harness recorded no recognized build script or target and skipped that step. This is a skipped build, not a successful build and not evidence that Lighthouse lacks build tooling.
We checked commit 6b04758 on 2026-10-23 with 3 CPUs and 8 GB of RAM, using the recorded image label lab-node:22. The error tail explicitly identifies Node.js v22.23.2, so that runtime version has log support. The image name alone would not establish it, and the supplied evidence does not identify the operating-system version.
The log shows an open operation targeting /work/repo/report/generator/../../dist/report/flow.js, followed by the failed command. That path resolves to dist/report/flow.js. The excerpt doesn't show why the required report file was unavailable. The README separately gives contributors a build-all command, but we did not measure a successful run of it. It would be a guess to say that invoking it fixes this failure.
The checkout contained 1507 files, about 153645 lines of source and 219.6 MB before installation. Our scan found 7 CI workflow files, no Dockerfile and no tests directory. The latter is a directory-detection signal, not proof that there are no checks. This run measured repository setup and its failing test step. It supplied no audited website score, page-speed improvement or accuracy comparison.
Local reports need a local Chrome browser
The README says report results are not processed or beaconed to a remote server. Lighthouse uses the Chrome browser on the machine doing the audit. That is useful for a private staging page reachable by your worker, provided you handle the page's authentication deliberately. A local audit does not require a hosted Lighthouse account.
The documented CLI needs Node 22 or later, and CHROME_PATH can select the browser binary. HTML is the default report format, with JSON available for scripts and saved artifacts available for later inspection. Keep the configuration with those artifacts. A report without the browser context or selected throttling profile is harder to compare when the next release appears slower.
Sharing has a separate boundary. The online viewer can open a report, while its share action asks you to sign in to GitHub and stores the report as a secret Gist. That upload is a different choice from running the local audit. Decide whether the report may leave your infrastructure before using the sharing feature for an internal page.
Resource contention can make a release gate misleading
The project's variability guide identifies changing page content and client resource contention among the causes of inconsistent results. It warns against concurrent Lighthouse runs on the same machine and recommends aggregates across repeated attempts. A busy CI worker is therefore part of the measurement problem, even if the command exits cleanly.
Keep an important page's user state consistent, avoid competing browser jobs on its worker, and retain reports from repeated runs. Set thresholds using that history before enforcing them. These are process recommendations grounded in the guide, not an experiment we completed. Our repository sandbox cannot tell you how much variation your pages will show or which threshold your business can tolerate.
sitespeed.io suits history, while axe-core focuses on accessibility
sitespeed.io supports scheduled performance monitoring with metrics sent to Graphite or InfluxDB. Its README also describes HTML reports with loading video and request waterfalls. Choose it when your question is how a site changes over time and you want that broader workflow. This is a scope comparison, not a measured claim that it is faster or easier to operate.
Axe-core is an accessibility testing engine for websites and HTML interfaces. Choose it when your immediate task is adding automated accessibility checks to existing functional tests. Its README explicitly leaves uncertain findings for manual review. Neither that narrower engine nor Lighthouse's accessibility category removes the need to inspect how people use the page.
October issue activity shows work on simulation accuracy
GitHub recorded a push on 2026-10-24 and 436 open issues and PRs. The recently updated list included an open issue about Lantern's LCP overestimation on large JavaScript applications and an open pull request changing simulated LCP breakdown calculations. These are upstream reports and proposed work, rather than inaccuracies we reproduced. They show why a simulated score deserves context and why the combined queue is not a confirmed bug count.
Our documentation rating is 4/5: clear CLI options, local-data boundaries and variance guidance meet our four-point bar, with a fifth point reserved for a documented contributor path independently verified here. We leave setup, support quality and production maturity unscored. Start with a page whose behavior you know, save repeated reports under controlled conditions, and make the release rule reflect the variation you actually observe.