Its 503 lines turn GitHub aggregate history into export files
GitHub Stars History fits its core job into about 503 lines of source: it asks GitHub for weekly aggregate star data, reconstructs the daily series, and writes the result as CSV or JSON. The summary adds recent growth windows, average stars per day, and the peak date. You can pass several repositories in one command, which is enough for a launch report or a comparison you plan to chart elsewhere. There is no database, login, or hosted account between your script and GitHub.
Most of the behavior lives in star_history.py, so a maintainer can inspect the request loop, aggregation, rate-limit handling, and exports without tracing a framework. The checkout we measured had 14 files. The program stores nothing beyond the files you ask it to create. It also gives you the raw daily rows instead of trapping the result inside a proprietary chart. That narrow scope is the reason to consider it.
Version 1.1.0 follows GitHub's privacy-safe replacement endpoint
GitHub restricted third-party access to stargazer lists in June 2026, then introduced an aggregate history endpoint in September. Version 1.1.0 moved this project to that replacement. The CLI calls /repos/{owner}/{repo}/stargazers/history, follows pagination links, expands each weekly bucket into dated rows, sorts them, and totals the counts. That makes the current release materially different from older star trackers that depended on a list of user accounts.
The privacy tradeoff is clear. You get counts for each day, not the people behind them. That is enough to compare launch timing or feed a chart. It cannot tell you whether a cluster of stars came from related accounts, and it cannot inspect account age or profile quality. The README suggests that spikes can prompt further investigation, but this data alone does not explain why a spike happened.
What happened when we ran it
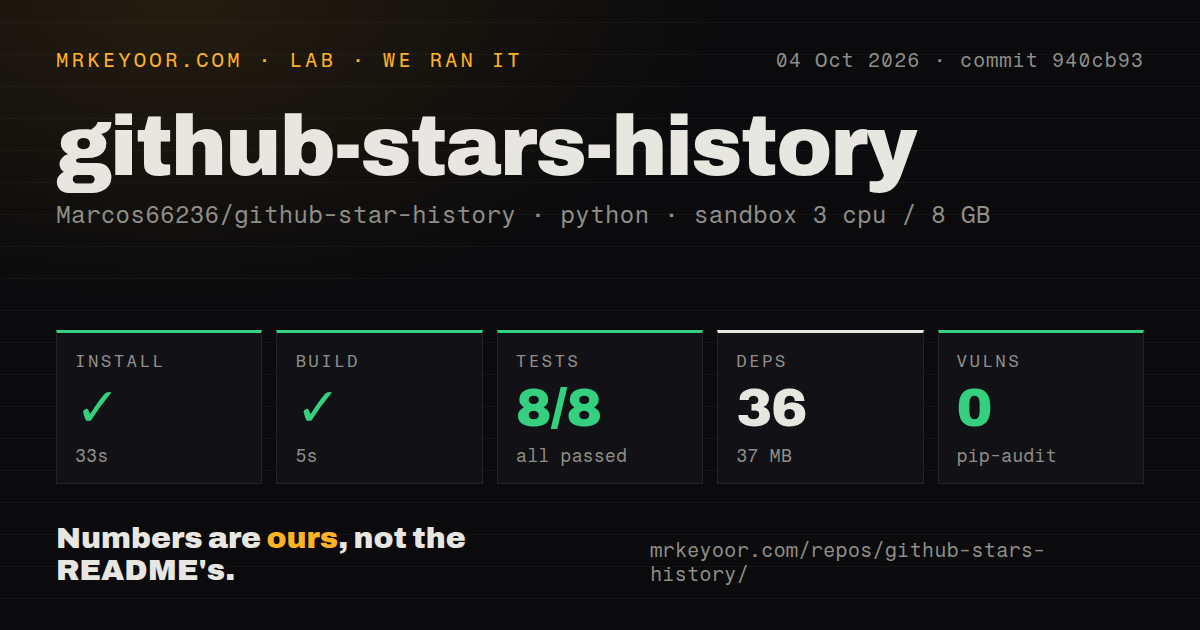
Our fresh Debian sandbox installed commit 940cb93 in 33 seconds. The environment gained 36 packages and used 37 MB on disk. The build completed in 5 seconds, then pytest passed 8 of 8 tests in another 5 seconds. Pip-audit reported 0 known vulnerabilities. Those results cover installation, packaging, and the supplied unit suite. They do not measure GitHub response time or the accuracy of a real repository's historical totals.
The tests exercise weekly-to-daily conversion, pagination, missing repositories, basic growth calculations, and both export formats. Network responses are mocked, so the green suite tells us the transformation code behaves as expected against its fixtures. It does not prove that GitHub will preserve the endpoint shape or that a long anonymous run will finish within its quota. No test failed in our run, and the log gave us no setup caveat to explain away.
Anonymous runs get 60 GitHub requests per hour
GitHub Stars History gives anonymous runs 60 requests per hour, while GITHUB_TOKEN raises the documented allowance to 5,000. The quick start is ordinary Python: clone the repository, install its requirements, and pass an owner/repo value. Public data works without a key. When no token is present, the CLI checks the remaining allowance and recommends one if the reported total is below 100.
Each history page covers weekly buckets, and the code follows every next link until GitHub stops returning one. It watches the rate-limit headers on each response and sleeps when five or fewer requests remain. That is polite API behavior, though a scheduled process may sit idle until reset. Add a token for repeated comparisons or older repositories, then treat it like any other credential. Private repositories require that token to carry access.
Exports land in the working directory under names derived from the repository. CSV contains date,stars rows. JSON includes fetch time, a summary, and the history array. There is no output-path flag, chart renderer, or database sink in the current command interface. Shell redirection will not change where the export helpers write, so automation should move or rename the generated file after a successful run.
The repository is recent, tested, and still lightly proven
GitHub showed 276 stars, 0 open issues and pull requests, and a last push on September 18, 2026. Release v1.1.0 shipped that day, one day after v1.0.0. The dates show recent work, while the two-tag history and empty issue list provide little evidence about how the project handles outside bug reports over time. Our clone also had no CI workflow file and no Dockerfile.
For a 503-line utility, that missing infrastructure is manageable. Copy the test command into your own CI, pin the commit you reviewed, and decide where exports belong. The bigger mistake would be treating star counts as a complete repository-health score. This tool gives you a clean time series. You still need release activity, issue handling, contributor behavior, and the event that caused a spike before drawing a decision from it.