bottom answers what this machine is doing now
btm fills a terminal with live graphs for CPU, memory, swap, network traffic, temperatures, and disk I/O. Tables show disk capacity, sensors, batteries, and processes. The process view supports sorting, searching, tree mode, and termination signals. A graph can zoom across different time windows, while expansion mode gives one widget most of the screen. It is a local diagnostic tool for the moment a laptop feels hot or a server shell becomes sluggish.
That boundary is useful. bottom does not ask for an account, start a metrics database, retain weeks of samples, or notify an on-call team. It watches the current host for as long as the program runs. For fleet health or post-incident history, use Prometheus, Netdata, or another monitoring service. For a quick answer during an SSH session, the absence of a service is an advantage.
Official support covers 3 operating systems
The project officially supports macOS on x86-64 and ARM64, Linux on x86-64, i686, and ARM64, plus 32-bit and 64-bit x86 Windows. It builds and tests with the current stable Rust release. FreeBSD, NetBSD, Android, Windows ARM, and several additional Linux architectures are listed as unofficial. They may compile, but CI coverage, available metrics, and maintainer support can be limited.
Cross-platform does not mean identical sensors. Operating systems expose different process, battery, thermal, and disk information, sometimes only with extra privileges. The Snap package requires mount, hardware, system, and process-control interfaces to be connected. Granting a monitor more authority should be a deliberate decision, especially when the process widget can send signals. Start without elevation and add only the access required for a specific missing metric or action.
What happened when we ran it
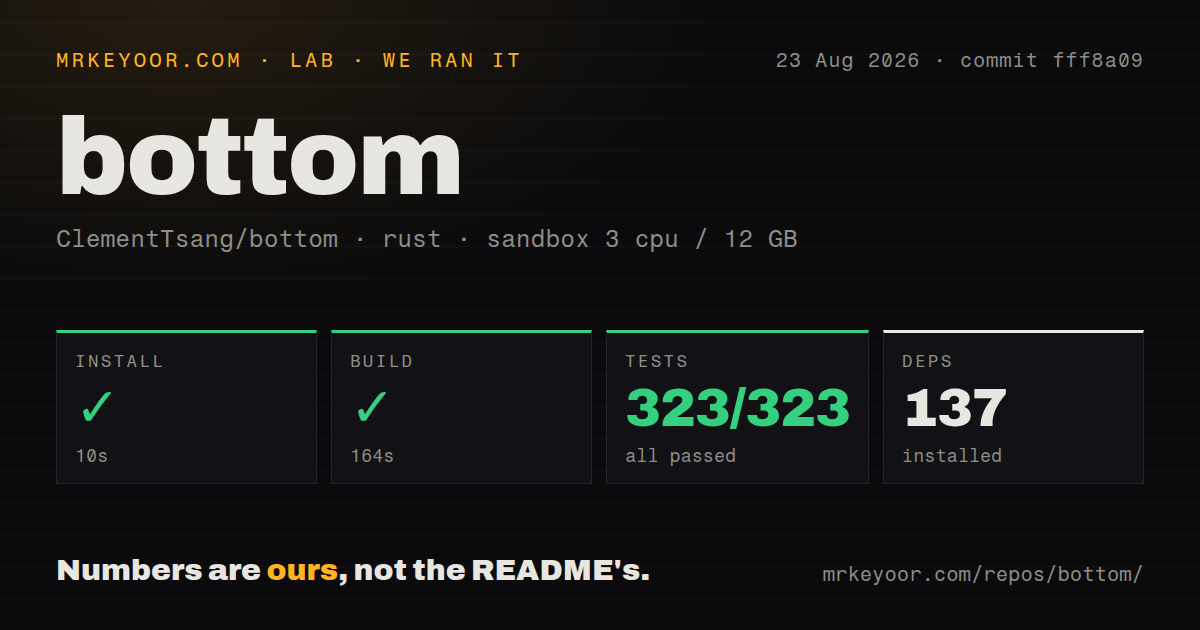
Our fresh Rust container completed the install stage in 10 seconds and resolved 137 packages. The repository checkout was 5.5 MB, containing 366 files and roughly 39,415 source lines. A release build succeeded in 164 seconds. The project had 11 CI workflow files, no Dockerfile, and a dedicated tests directory. Nothing in this path required a network service, database, API key, or secret.
The full Cargo test run completed in 62 seconds. All 323 tests passed and none failed. Among the 7 repositories in this assignment, bottom was the only compiled application whose install, build, and test stages all finished successfully. These timings came from our 3-CPU, 12 GB unprivileged Debian sandbox at commit fff8a09; they describe source verification on that machine rather than terminal refresh speed or runtime resource use.
Compiling from source is optional for most users. The README lists packages for Alpine, Arch, Debian, Fedora-family systems, Gentoo, Nix, openSUSE, Snap, Solus, Void, Homebrew, MacPorts, Chocolatey, Scoop, winget, Conda, and mise. Releases also provide native archives and a Windows installer. A package-manager install avoids the 164-second Rust build and is the sensible default unless you need a patch or a special target.
Configuration changes the dashboard without a plugin system
Command-line flags and a generated configuration file control themes, widget behavior, layout, filters, units, and other presentation choices. Basic mode offers a layout closer to htop, while expansion mode focuses on one widget. Shell completion files are published for Bash, Zsh, fish, PowerShell, Elvish, Fig, and Nushell. This is enough customization for most terminals without turning the monitor into an extension host.
The interface can still be too dense on a narrow session. Charts, tables, legends, and process columns compete for cells, so a small SSH pane benefits from basic mode or a custom layout. Search filtering also has limits: issue 1897 proposes richer operators such as != and a clearer distinction between literal, regular-expression, and query modes. Current search is useful, but it is not a full process-query language.
GPU data and automatic theme switching remain gaps
CPU, RAM, disks, network, temperatures, and batteries cover routine diagnosis. GPU and VRAM load do not appear in the documented widget list, and issue 298 remains open. A separate issue tracks use of a future system-information GPU API. Anyone debugging model training, games, or video workloads will still need nvidia-smi, vendor tools, or another monitor with working GPU support on that platform.
Theme behavior has a smaller irritation. bottom offers built-in and custom color themes, but issue 1284 requests automatic light or dark selection based on the terminal background. Users who switch their terminal with the operating-system theme may need to change bottom's theme themselves. These are feature gaps rather than failures in the core process and system views, and both are visible in the public queue.
Release 0.14.8 fixes cgroup and menu bugs
Version 0.14.8 was released on August 13, 2026. It fixes closing behavior in the sort menu, corrects cgroups v1 swap collection around a sentinel maximum value, and repairs schema links. The repository was pushed on August 26, and recent work included the 0.14.9 version update plus process-memory and progress-bar changes. GitHub showed 108 issues and pull requests combined, many of which are feature requests accumulated across years.
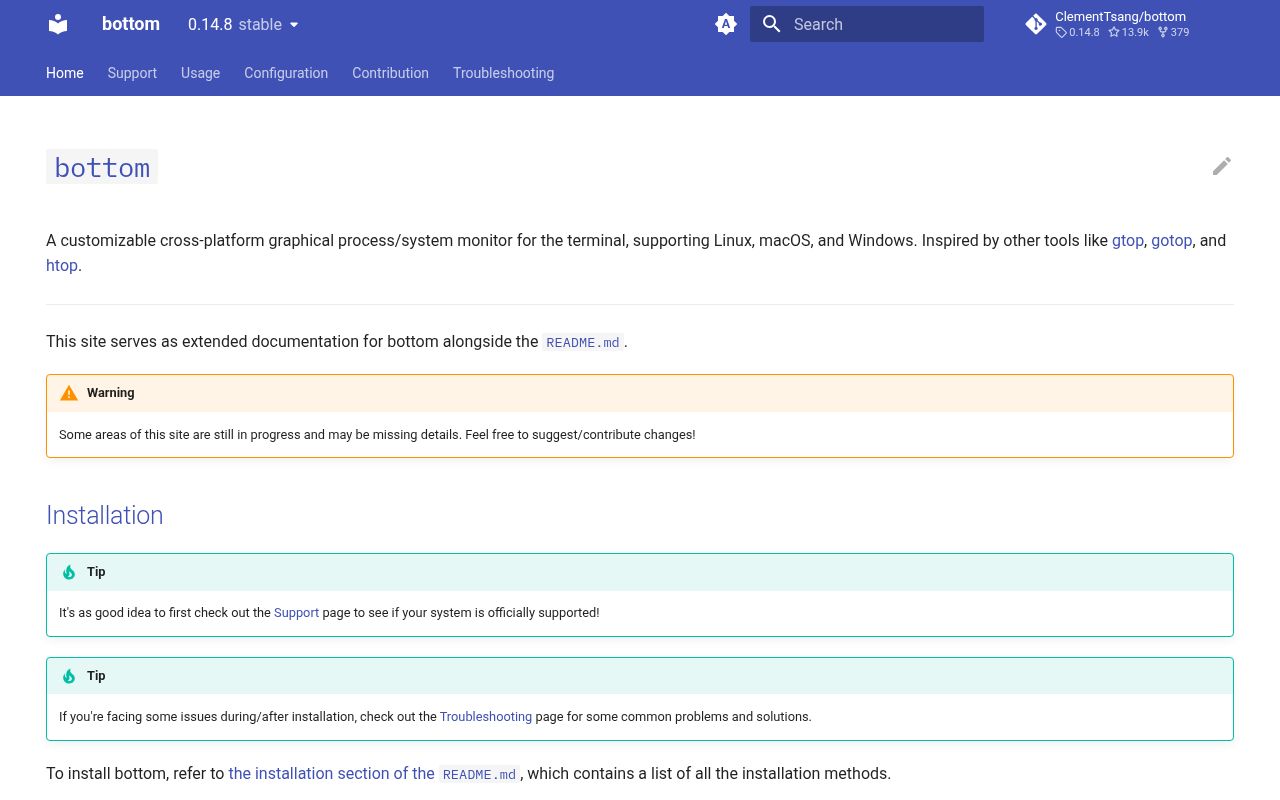
The maintenance signals agree: current release, current push, active pull requests, a broad package ecosystem, and a clean 323-test run in our sandbox. Documentation is similarly practical, with separate stable and nightly sites, platform support tables, configuration references, and troubleshooting advice. The project does not pretend every unofficial system works like Linux, which makes its support claims easier to trust.
Pick bottom for interactive local diagnosis
bottom is a good default when top feels too sparse and a browser dashboard is excessive. It combines recent trends with direct process action, installs almost everywhere, and keeps its state local. htop is better for users who live in the process tree, btop deserves a look for a different visual emphasis, and procs is easier to compose with command-line work. For the specific job of watching one machine in a terminal, bottom is ready to use.