mrkeyoor.com_
Sat 19 Sept 03:40 UTC
Self-Hostedevaluationupdated 19 Sept 2026

alertmanager review

Alertmanager receives alerts from Prometheus and other clients, groups duplicates, applies silences and inhibition rules, then sends notifications to the right service or team. It solves the noisy middle of alerting after another system has decided that something is wrong.

Verdict

Our Alertmanager run built in 2 seconds, but 9 of 77 tests failed in acceptance areas that include silences, webhooks, cold starts, and reloads. It remains the natural notification router for a Prometheus stack, provided you treat its YAML and templates like deployed code and test the exact release. Choose a different product if you chiefly need on-call scheduling, incident ownership, or an all-in-one monitoring interface.

We ran it

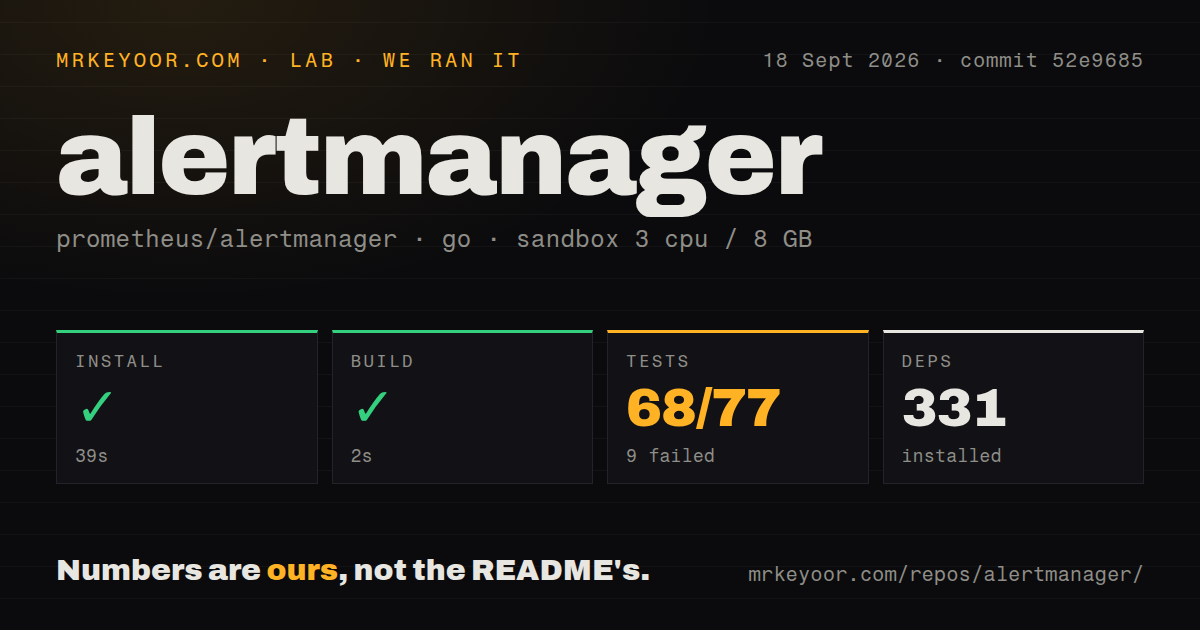
Lab card: what happened when we ran alertmanagerScreenshot of alertmanager (prometheus.io)
Install✓ · 39s331 packages
Build✓ · 2s
Tests✗ · 97s68 passed · 9 failed of 77 (go test)
Repo715 files~96,747 lines of source · 4.1 MB · 10 CI workflows · Dockerfile · tests dir

Answers from our run

Does alertmanager build from source?

Dependencies installed in 39 seconds (331 packages), and the build succeeded in 2 seconds. We cloned commit 52e9685 into a clean Debian container with 3 CPUs and no project-specific setup.

Do alertmanager's tests pass?

Not all of them: 68 of 77 passed and 9 failed when we ran the project's own test command (go test). Some failures need services or credentials a bare container does not have.

Who should not use alertmanager?

Teams looking for metrics collection or alert evaluation: Alertmanager only handles alerts sent by Prometheus or another client.

What are the alternatives to alertmanager?

GoAlert, Alerta, Netdata. Our Alertmanager run built in 2 seconds, but 9 of 77 tests failed in acceptance areas that include silences, webhooks, cold starts, and reloads.

Setup4/539-second install and 2-second build; acceptance tests failed
Docs5/5Routing, receivers, API, CLI, and clustering are documented
Community5/58,617 stars, a September 2026 push, and active issue work
Maturity4/5Established HA design, offset by 9 failed acceptance tests

Discussed on

  1. hnSome thoughts on Prometheus Alertmanager's alert reminders24 points
  2. hnSimple steps to set up Kafka alerts to Prometheus Alertmanager15 points
  3. hnEasy Guide to Set Up Prometheus Alertmanager with Slack, PagerDuty, and Gmail6 points
  4. hnAsk HN: How complex are your Alertmanager routes?3 points

Who it’s for

Prometheus operators who need one place to group, mute, and route alerts.
Platform teams with label-based ownership rules and several notification services.
Reliability teams prepared to test routing, templates, and silences as production code.
Operators who need multiple Alertmanager peers for notification availability.

Who it’s NOT for

Teams looking for metrics collection or alert evaluation: Alertmanager only handles alerts sent by Prometheus or another client.
Kubernetes operators expecting changed ConfigMaps to reload by themselves: open issue 5197 says Alertmanager still needs SIGHUP, POST /-/reload, or an external reloader.
Operators who put a generic load balancer in front of every clustered service: the README tells Prometheus to send every alert to every Alertmanager peer.
Teams unwilling to regression-test mute behavior during upgrades: v0.34.1 fixed several inhibition bugs that could improperly unmute alerts.
Buyers who need on-call schedules and incident case management in the same product: the documented scope is grouping, routing, inhibition, silences, and delivery.

Setup reality

Our sandbox install succeeded in 39 seconds and pulled 331 packages. The build passed in 2 seconds. Tests failed after 97 seconds: go test reported 68 passed and 9 failed out of 77, with failures in silence, webhook timeout, cold-start, and reload acceptance cases.

Running the service needs a YAML routing tree plus credentials for receivers such as email or PagerDuty. Prometheus or another client must produce the alerts. Source builds require Go and Node.js with npm, while releases also ship binaries and container images.

High availability needs peer addresses and port 9094 open for both TCP and UDP. Prometheus must send alerts to every peer instead of placing them behind a load balancer. Config file changes need SIGHUP, the reload endpoint, or an external watcher.

Alertmanager receives existing alerts and cuts duplicate noise

Alertmanager's API v2 accepts alerts that Prometheus or another client has already produced. It groups related events, suppresses lower-priority noise through inhibition, applies temporary silences, and chooses a receiver. That narrow job matters during an outage. A database failure might trigger hundreds of instance alerts, while the person on call needs one useful notification with the affected systems attached.

The routing tree is the center of the product. Labels such as service, cluster, and severity decide which branch an alert follows. Timing settings control the first group wait, later additions, and repeat notifications. The bundled amtool can inspect live alerts, add or expire silences, render templates, show the route tree, and verify that a sample label set reaches an expected receiver. Those checks are worth putting beside the YAML in review.

The source build passed in 2 seconds, while receiver setup takes longer

Our build of commit 52e9685 succeeded in 2 seconds. Released binaries and container images make the first launch easy, and the web service listens on port 9093 in the README example. Useful delivery takes more work. Every receiver needs its address and credentials, the root route needs a default destination, and child routes inherit settings unless you override them. A valid file can still route an alert to the wrong team, wait too long, or repeat too often.

Source builds require Go plus Node.js and npm. Our commit 52e9685 checkout contained 715 files, about 96,747 lines of source, and 10 CI workflow files. It also included a Dockerfile and a tests directory. The repository is compact at 4.1 MB, but that figure says little about the effort of modeling team ownership in labels and keeping receiver secrets outside the configuration file.

What happened when we ran it

Our measurement setup was a fresh Debian sandbox with 3 CPUs and 8 GB of RAM. Installing 331 packages took 39 seconds, and the build succeeded in 2 seconds. That is a pleasant result for contributors who need a local binary quickly, and it supports the README's claim that compiling through make build is a practical path rather than a ceremonial one.

The test run was different. It exited with code 1 after 97 seconds, with 68 passed and 9 failed out of 77. The log tail named TestSilenceDelete, TestWebhookTimeout, TestSilencing, TestAddSilence, TestColdStart, and TestReload among the failures in the API v2 acceptance package. It does not show enough evidence to assign a cause. The defensible conclusion is that this exact checkout did not pass its full test command in our fresh Debian container.

Every Alertmanager peer must receive every alert

Since Alertmanager 0.15, clustered peers have required both TCP and UDP on port 9094. Prometheus must send alerts to each peer, while notification state and silences are replicated between them. The project explicitly tells users to list every Alertmanager target and warns against load balancing traffic between Prometheus and the cluster.

That design asks for a specific network and deployment model. A 3-peer setup needs stable peer discovery, firewall rules for both protocols, and monitoring for convergence. Setting an empty cluster listen address disables high availability for a single instance. None of this is excessive for a notification service, but it is more deliberate than adding replicas behind an ingress and assuming the job is done.

Config files do not reload themselves

The v0.32.0 report in open issue 5197 records config reloads through SIGHUP or POST /-/reload, with no automatic file watch. The practical Kubernetes consequence is that a mounted ConfigMap or Secret can change while the running process keeps the old configuration unless a sidecar or another controller calls the reload path. Deployment manifests therefore need an explicit reload mechanism.

Templates can also fail in ways that are hard to diagnose from the downstream error. Open issue 5322 reports template rendering errors being swallowed before a Slack request fails with a less useful complaint. amtool template render catches template problems before deployment, though alert-dependent values still need representative fixtures. Between that issue and our 9 failed acceptance tests, route and notification tests belong in the release checklist.

v0.34.1 fixed alerts that inhibition had improperly unmuted

GitHub showed 8,617 stars and 417 combined open issues and pull requests when fetched. The repository was pushed on September 18, 2026, and v0.34.1 had shipped one day earlier. That release fixed several inhibition bugs that could cause alerts to be improperly unmuted. The dates and active pull requests point to current maintenance, while the size of the queue calls for checking the issues tied to features you depend on.

Alertmanager is a good choice when Prometheus already owns detection and you need dependable grouping and delivery. Its 39-second install and 2-second build lower the cost of evaluating it, but the failed acceptance run rules out a casual green light for commit 52e9685. Pin a release, test real label sets with amtool, exercise silences and reloads, and send synthetic notifications through every receiver before trusting the route at 3 a.m.

Alternatives

ProjectWhat it isPick it when
GoAlertAn on-call scheduling and escalation system that accepts alerts and tracks who should respond.pick this instead when rotations, escalations, and acknowledgement are the main job.
AlertaA self-hosted alert console focused on deduplication, correlation, and operator views.pick this instead when a central cross-source alert dashboard matters more than Prometheus-native routing.
Netdata gh↗A broader monitoring system with data collection, dashboards, and alerting in one project.pick this instead when you also need the monitoring and visualization layers.

What people are saying

  1. [github-trending] prometheus/alertmanager

Sources

  1. Alertmanager README
  2. Prometheus Alertmanager documentation
  3. Alertmanager v0.34.1 release
  4. Native config auto-reload request
  5. Notification template error report

More self-hosted reviews

go-music-dl · fleet · Memoh · audiobookshelf · jitsi-meet · celld · the whole board →