@visx/scale review
@visx/scale 4.0.0 wraps D3 scale constructors in typed configuration objects used across visx charts. Its callable scales map numeric, categorical, temporal, radial, or distribution domains into pixels, colors, sizes, and buckets. The package renders no axis, bar, legend, tooltip, or accessible chart structure. Our full-package browser import measured 50.9 KB minified and 17.7 KB gzipped. Version 4 adds explicit ESM and CommonJS export paths and coordinated package versions across visx; the scale package itself still has no React peer dependency, though related visx 4 React packages require React 18 or 19.
@visx/scale 4.0.0 installed in 2.7 seconds and its full import measured 17.7 KB gzipped with 0 audit findings in our sandbox. It fits a visx-based chart system that imports selected factories; use `d3-scale` directly for scale math alone and a higher-level chart library when rendering and accessibility must arrive together.
We installed it
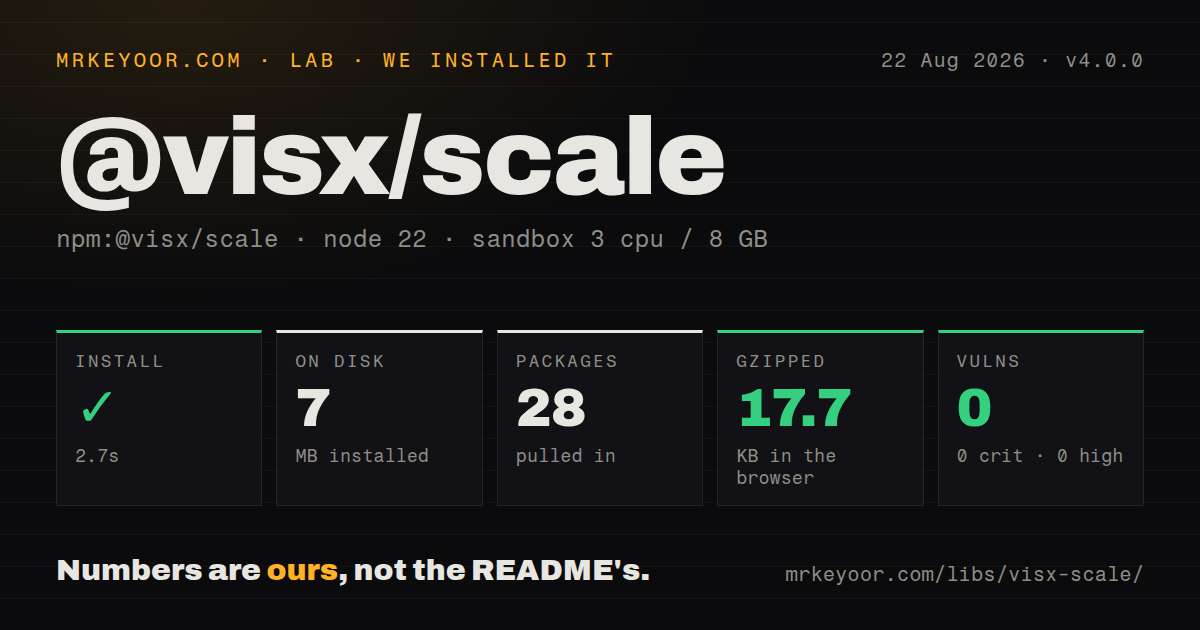
| Install | ✓ · 2.7s | 28 packages on disk · 7 MB |
| Import | ✓ | ESM import works · require() works · CommonJS package with exports map |
| Browser | 17.7 KB | gzipped (50.9 KB minified), bundled with esbuild |
| Types | ✓ | TypeScript types bundled |
| Known vulns | 0 | 0 critical · 0 high · 0 moderate · 0 low (npm audit) |
Answers from our run
Does @visx/scale install cleanly?
Yes. In a fresh container with an empty cache, npm install @visx/scale finished in 3 seconds, leaving 28 packages and 7 MB on disk. npm audit reported no known vulnerabilities.
How much does @visx/scale add to a browser bundle?
17.7 KB gzipped (50.9 KB minified) when the whole package is bundled for the browser with esbuild. Importing only part of it is usually smaller.
Does @visx/scale work with both ESM and CommonJS?
Yes. Both import '@visx/scale' and require('@visx/scale') worked in Node 22 in our run. The package is published as CommonJS with an exports map.
Does @visx/scale include TypeScript types?
Yes, type declarations ship inside the package, so no @types install is needed.
@visx/scale or d3-scale: which should you use?
d3-scale: Use the upstream constructors directly when visx config helpers add no value. @visx/scale 4.0.0 installed in 2.7 seconds and its full import measured 17.7 KB gzipped with 0 audit findings in our sandbox.
When should you not use @visx/scale?
The project already calls d3-scale directly. This wrapper adds visx config operators without changing the underlying scale model.
Use it if
- A visx chart system wants one object-config style for band, linear, time, log, ordinal, and bucket scales.
- TypeScript must infer the callable and methods for several D3-style scale families.
- Runtime configuration chooses a scale `type`, and shared code needs generic tick and update helpers.
- The application already pays for visx and wants scale behavior aligned with its axes and legends.
- The project already calls `d3-scale` directly. This wrapper adds visx config operators without changing the underlying scale model.
- You expect a finished chart. Axes, marks, legends, tooltips, responsive layout, and accessibility come from other code or packages.
- A 17.7 KB gzipped full import exceeds the budget. Import only the needed factories and confirm tree-shaken output.
- Built-in animation is required. The visx project deliberately leaves transitions to the application's animation library.
- Other visx packages must stay on v3. The v4 migration guide calls for coordinated major upgrades and removes deep entry-point imports.
Setup reality
We installed @visx/scale 4.0.0 in 2.7 seconds in a fresh Node 22 Bookworm sandbox. It left 28 packages and 7 MB on disk. The package has 1 direct dependency, 0 peer dependencies, 808 KB unpacked, and an MIT license. npm audit found 0 known vulnerabilities. No native build, credential, or configuration file is involved.
The package is CommonJS with an exports map that also points imports to ESM output. Both require() and ESM import worked on our box, and TypeScript declarations are bundled. Import from the package root because visx 4 formalized entry points and removed support for deep internal paths. Related React packages require React 18 or 19, while @visx/scale itself declares no peer.
Our full import bundled to 50.9 KB minified and 17.7 KB gzipped. The package is marked side-effect-free, so production code should import only the scale factories it uses and inspect the actual tree-shaken chunk. Scales are mutable callable objects; updateScale() copies before applying new config. React components should memoize a scale when identity affects children or effects.
Continuous scales extrapolate unless clamped. Band lookups return undefined for unknown categories. Log domains cannot include 0 or cross signs; use symlog for signed data. scaleTime follows local time, while scaleUtc gives consistent time-zone boundaries. Quantize uses equal numeric intervals, quantile uses the sample distribution, and threshold uses explicit breakpoints, so tests should assert the final domain, range, and bucket boundaries.
Patterns
Map a numeric domain to pixels map-linear-values
import { scaleLinear } from '@visx/scale';

const yScale = scaleLinear({
  domain: [0, Math.max(...values)],
  range: [chartHeight, 0],
  nice: true,
  clamp: true,
});

const y = yScale(value);
The `[chartHeight, 0]` range puts larger data values higher in SVG; `nice` can extend the supplied maximum.
Position categorical bars layout-band-chart
import { scaleBand } from '@visx/scale';

const xScale = scaleBand({
  domain: data.map((row) => row.category),
  range: [0, innerWidth],
  padding: 0.2,
  round: true,
});

const x = xScale(row.category);
const width = xScale.bandwidth();
An unlisted category returns `undefined`, so check `x` before using it as an SVG coordinate.
Center categories without bandwidth position-categorical-points
import { scalePoint } from '@visx/scale';

const xScale = scalePoint({
  domain: ['Q1', 'Q2', 'Q3', 'Q4'],
  range: [0, innerWidth],
  padding: 0.5,
});
`scalePoint` has no `bandwidth()` for bar rectangles; it places category centers for dots or vertices.
Create a local-time axis scale scale-local-time
import { scaleTime } from '@visx/scale';

const xScale = scaleTime({
  domain: [new Date(2026, 0, 1), new Date(2026, 11, 31)],
  range: [0, innerWidth],
  nice: true,
});

const ticks = xScale.ticks(6);
Local calendar boundaries can differ around daylight-saving changes; switch to UTC when server and browser ticks must match.
Keep temporal ticks in UTC scale-utc-time
import { scaleUtc } from '@visx/scale';

const xScale = scaleUtc({
  domain: [new Date('2026-01-01T00:00:00Z'), new Date('2026-02-01T00:00:00Z')],
  range: [0, innerWidth],
});
The domain and ticks use UTC boundaries, while label formatting remains a separate explicit choice.
Use a logarithmic scale scale-orders-of-magnitude
import { scaleLog } from '@visx/scale';

const sizeScale = scaleLog({
  domain: [1, 1_000_000],
  range: [2, 40],
  base: 10,
  clamp: true,
});
Both domain ends must stay on one side of 0; a log scale is undefined across zero.
Use symmetric log around zero scale-signed-values
import { scaleSymlog } from '@visx/scale';

const xScale = scaleSymlog({
  domain: [-10_000, 10_000],
  range: [-200, 200],
  constant: 10,
});
The domain can cross 0, and `constant: 10` sets how much of the center behaves linearly.
Map categories to fixed colors assign-category-colors
import { scaleOrdinal } from '@visx/scale';

const colorScale = scaleOrdinal({
  domain: ['success', 'warning', 'error'],
  range: ['#16803c', '#a15c00', '#b42318'],
  unknown: '#777777',
});
The explicit fallback prevents a new category from silently entering the domain and taking a palette slot.
Quantize a numeric interval bin-even-intervals
import { scaleQuantize } from '@visx/scale';

const severity = scaleQuantize({
  domain: [0, 100],
  range: ['low', 'medium', 'high'],
});

console.log(severity(72)); // high
The 0 to 100 interval is split evenly; the number of observations in each bucket may be very different.
Create quantile buckets from samples bin-by-distribution
import { scaleQuantile } from '@visx/scale';

const quartile = scaleQuantile({
  domain: observations,
  range: ['q1', 'q2', 'q3', 'q4'],
});

const boundaries = quartile.quantiles();
Pass the observed sample values because repeated values and outliers determine the returned quantile boundaries.
Map caller-defined breakpoints apply-explicit-thresholds
import { scaleThreshold } from '@visx/scale';

const risk = scaleThreshold({
  domain: [20, 50, 80],
  range: ['minimal', 'low', 'high', 'critical'],
});
Three thresholds require 4 output labels; tests should pin the equality behavior at 20, 50, and 80.
Create a typed scale from configuration create-runtime-scale
import { createScale, getTicks, inferScaleType, updateScale } from '@visx/scale';

const scale = createScale({
  type: 'linear',
  domain: [0, 10],
  range: [0, 400],
});

const resized = updateScale(scale, { range: [0, 800] });
console.log(inferScaleType(resized), getTicks(resized, 5));
`updateScale` leaves the first scale's range unchanged by applying the new config to a copy.
Alternatives
| Package | Registry | Pick it when |
|---|---|---|
| d3-scale | npm | Use the upstream constructors directly when visx config helpers add no value. |
| @nivo/scales | npm | Use it when scales should match Nivo's higher-level chart components. |
| chroma-js | npm | Use it when color interpolation and color-space conversion are the primary tasks. |
More web frontend guides
postcss · react · react-dom · tailwindcss · htmlparser2 · tailwind-merge · the whole shelf →
How this guide is made: grounded in the library's documentation, release notes, changelog, and issue history, on a fixed rubric — not a hands-on install of every release. The 50 most-downloaded entries are additionally install-verified in clean containers. Corrections: contact the desk.