@visx/group review
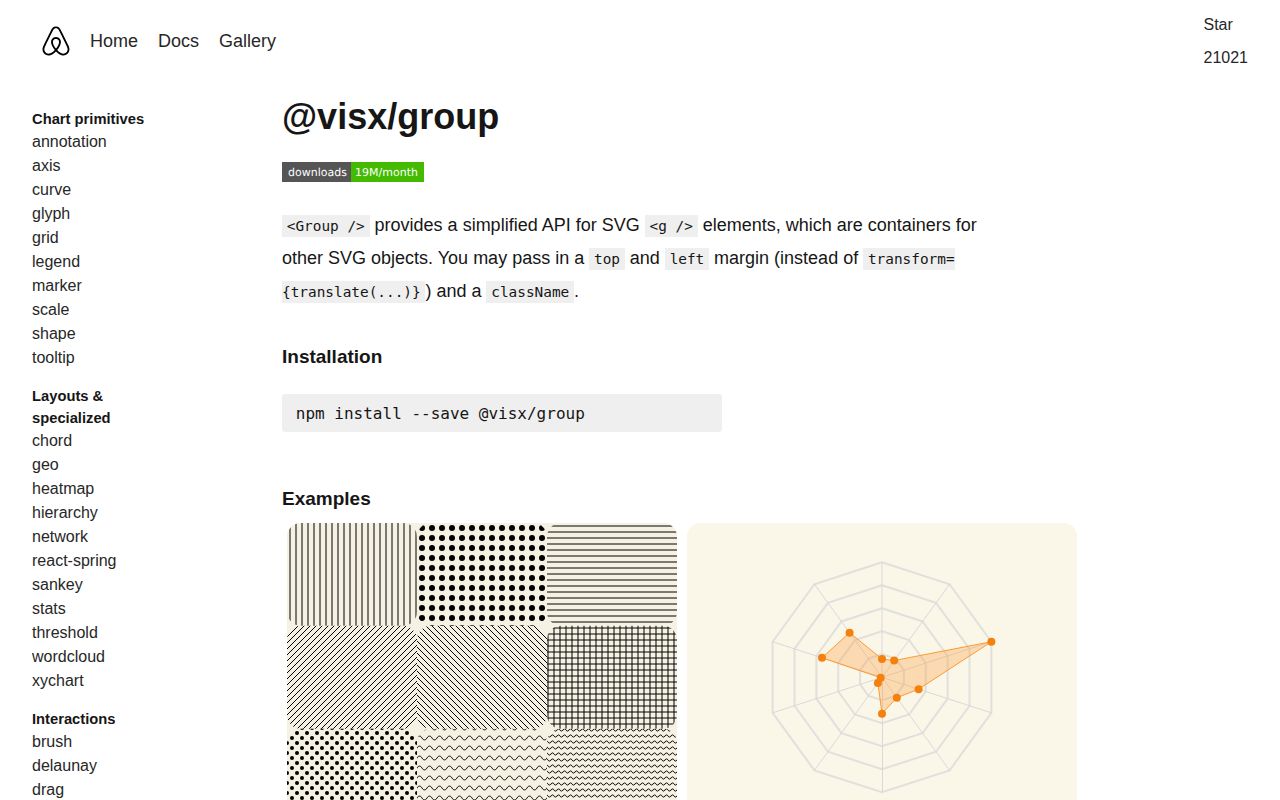
@visx/group 4.0.0 exports one React component that renders an SVG `<g>`. Numeric `left` and `top` props become `translate(left, top)`, a custom `transform` can replace that translation, `innerRef` exposes the `SVGGElement`, and remaining SVG group props pass through. It always adds the `visx-group` class. Group creates no chart, scale, axis, layout, animation, tooltip, accessibility description, or responsive container. Version 4 requires React 18 or 19, publishes package-root import and require entries, removes generated runtime PropTypes, and targets modern browsers; React 16, React 17, and IE11 users are told to stay on visx 3.
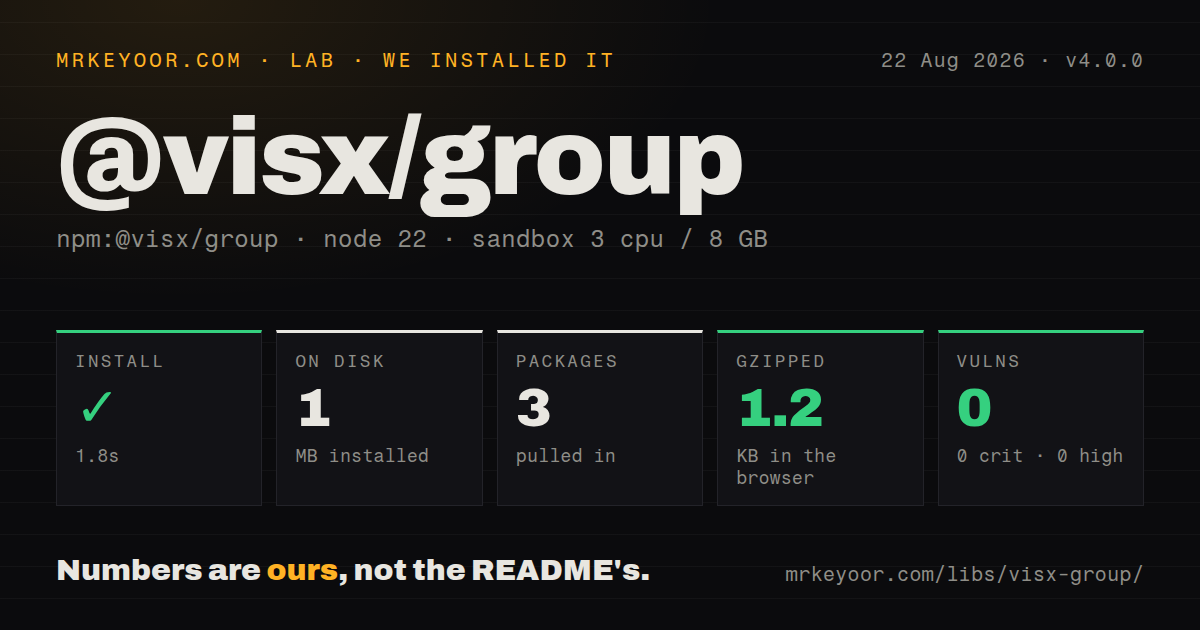
@visx/group 4.0.0 installed in 1.8 seconds, used 1 MB, passed npm audit, and added 1.2 KB gzipped to our browser build. It is worth installing inside a visx 4 chart system that repeats translated groups; a standalone chart or a couple of native `<g>` elements do not justify it.
We installed it
| Install | ✓ · 1.8s | 3 packages on disk · 1 MB |
| Import | ✓ | ESM import works · require() works · CommonJS package with exports map |
| Browser | 1.2 KB | gzipped (2.4 KB minified), bundled with esbuild |
| Types | ✓ | TypeScript types bundled |
| Known vulns | 0 | 0 critical · 0 high · 0 moderate · 0 low (npm audit) |
Answers from our run
Does @visx/group install cleanly?
Yes. In a fresh container with an empty cache, npm install @visx/group finished in 2 seconds, leaving 3 packages and 1 MB on disk. npm audit reported no known vulnerabilities.
How much does @visx/group add to a browser bundle?
1.2 KB gzipped (2.4 KB minified) when the whole package is bundled for the browser with esbuild. Importing only part of it is usually smaller.
Does @visx/group work with both ESM and CommonJS?
Yes. Both import '@visx/group' and require('@visx/group') worked in Node 22 in our run. The package is published as CommonJS with an exports map.
Does @visx/group include TypeScript types?
Yes, type declarations ship inside the package, so no @types install is needed.
@visx/group or recharts: which should you use?
recharts: Use it for composed React charts with axes, legends, tooltips, responsiveness, and animation included. @visx/group 4.0.0 installed in 1.8 seconds, used 1 MB, passed npm audit, and added 1.2 KB gzipped to our browser build.
When should you not use @visx/group?
Only 1 or 2 translated groups exist. A native <g transform=...> shows the complete behavior and avoids another package.
Use it if
- A React chart already uses visx primitives and needs the same `left` and `top` convention for axes, marks, or margins.
- Nested SVG coordinate systems appear often enough that a named typed component is clearer than repeated transform strings.
- The underlying `<g>` needs ordinary SVG attributes, React event handlers, data attributes, or an explicit element ref.
- The team wants low-level composition and will own chart layout, interaction, motion, and accessibility.
- Only 1 or 2 translated groups exist. A native `<g transform=...>` shows the complete behavior and avoids another package.
- The application runs React 16 or 17, or still supports IE11. The v4 migration guide says those consumers should remain on visx 3.
- You want ready-made charts, axes, legends, tooltips, responsive sizing, or animation. Group supplies none of those pieces.
- The render target is HTML or Canvas. The component always emits SVG `<g>`, which belongs inside an SVG tree.
- A custom rotate or scale should automatically combine with `left` and `top`. Any truthy `transform` replaces the generated translation.
Setup reality
We installed @visx/group 4.0.0 in a fresh Node 22 Bookworm sandbox in 1.8 seconds. It left 3 packages and 1 MB on disk. npm audit reported 0 known vulnerabilities. The package has 1 direct dependency, 2 peer dependencies, bundled TypeScript declarations, an exports map, and 60 KB unpacked. Both CommonJS require() and ESM import worked on Node 22.23.2. Our browser build measured 2.4 KB minified and 1.2 KB gzipped.
React 18 or 19 is required. TypeScript projects should install the matching @types/react, which v4 declares as an optional peer rather than bundling. Upgrade all @visx/* packages to the same major and replace internal deep imports with package-root imports. The package itself installs only classnames; shapes, scales, axes, tooltips, responsive helpers, and text remain separate packages. The v4 migration also removed generated PropTypes, so code that inspected component propTypes at runtime must provide its own validation.
Group does not create an <svg>. Outside an SVG tree, its <g> has no useful chart rendering. Missing offsets default to 0 and still produce translate(0, 0). A truthy custom transform wins over left and top; include translation inside that string when it must combine with rotation or scale. className is merged with the permanent visx-group class, and other SVG props are spread after the explicit attributes. The documented ref prop is innerRef, not React's ordinary ref.
Server rendering produces plain SVG markup, but browser geometry such as getBBox() exists only after layout. Measure in an effect and rerun when data or fonts change. Group forwards pointer and keyboard handlers without supplying a role, focusability, key behavior, title, description, or data-table fallback. Interactive marks need those semantics from the application. Clip-path IDs also live at document scope, so repeated or server-rendered charts need unique IDs to avoid collisions.
Patterns
Offset SVG children translate-group
import { Group } from '@visx/group';

<svg width={320} height={180}>
  <Group left={24} top={16}>
    <circle cx={20} cy={20} r={12} fill={'tomato'} />
  </Group>
</svg>
Group writes a 24 by 16 translation. It does not resize the 320 by 180 viewport or reserve layout space.
Create an inner plotting area apply-margins
const margin = { top: 20, right: 16, bottom: 32, left: 48 };
const innerWidth = width - margin.left - margin.right;
const innerHeight = height - margin.top - margin.bottom;

<svg width={width} height={height}>
  <Group left={margin.left} top={margin.top}>
    <rect width={innerWidth} height={innerHeight} fill={'none'} />
  </Group>
</svg>
Group applies only 1 translation. Your code must subtract margins from scale ranges and mark dimensions.
Build nested coordinate systems nest-coordinates
<Group left={margin.left} top={margin.top}>
  <Group left={plotX} top={plotY}>
    {points.map((point) => (
      <circle key={point.id} cx={point.x} cy={point.y} r={3} />
    ))}
  </Group>
</Group>
SVG composes both translations. Each point is positioned relative to the 2 parent groups.
Provide a complete transform set-transform
<Group transform={'translate(120 80) rotate(-30) scale(1.2)'}>
  <rect x={-20} y={-8} width={40} height={16} />
</Group>
A truthy `transform` overrides both offsets. Include `translate` yourself when rotation or scale also needs positioning.
Group each data series render-series
{series.map((item, index) => (
  <Group
    key={item.id}
    className={'chart-series'}
    top={index * rowHeight}
    data-series-id={item.id}
  >
    <path d={item.path} fill={item.color} />
  </Group>
))}
The custom class is combined with `visx-group`. Data attributes and other SVG props pass through to each `<g>`.
Share SVG presentation attributes inherit-styles
<Group fill={'#64748b'} stroke={'currentColor'} opacity={0.7}>
  <circle cx={10} cy={10} r={4} />
  <circle cx={30} cy={20} r={4} />
</Group>
Many SVG presentation attributes inherit through 1 group. An explicit child value can override the inherited fill, stroke, or opacity.
Make a group keyboard operable handle-keyboard
<Group
  role={'button'}
  tabIndex={0}
  aria-label={`Select ${series.name}`}
  onClick={() => selectSeries(series.id)}
  onKeyDown={(event) => {
    if (event.key === 'Enter' || event.key === ' ') selectSeries(series.id);
  }}
>
  {marks}
</Group>
Group supplies 0 interaction semantics. Add focus, a name, and keyboard behavior whenever a grouped mark acts like a control.
Describe an SVG group label-graphic
<Group role={'img'} aria-labelledby={'revenue-title revenue-desc'}>
  <title id={'revenue-title'}>Monthly revenue</title>
  <desc id={'revenue-desc'}>Bars from January through June</desc>
  {bars}
</Group>
The component creates no title or description. Test the 2 references with the target browsers and assistive technologies.
Clip marks to plot bounds clip-marks
<svg width={width} height={height}>
  <defs>
    <clipPath id={clipId}><rect width={innerWidth} height={innerHeight} /></clipPath>
  </defs>
  <Group left={margin.left} top={margin.top} clipPath={`url(#${clipId})`}>
    {marks}
  </Group>
</svg>
Clip-path IDs are document-wide. Generate a unique `clipId` for each repeated or server-rendered chart.
Measure after browser layout measure-group
const groupRef = useRef<SVGGElement>(null);
useLayoutEffect(() => {
  const bounds = groupRef.current?.getBBox();
  if (bounds) setBounds(bounds);
}, [marks]);

return <Group innerRef={groupRef}>{marks}</Group>;
`getBBox()` is unavailable during server rendering. Use `innerRef` and measure after mount, then repeat after data or fonts change.
Place a bottom axis position-axis
import { AxisBottom } from '@visx/axis';

<Group left={margin.left} top={margin.top}>
  {marks}
  <Group top={innerHeight}>
    <AxisBottom scale={xScale} />
  </Group>
</Group>
`@visx/axis` is a separate installation. Keep it on major 4 and reuse the same scale that positions the marks.
Use a plain group for one offset use-native-svg
const transform = `translate(${left}, ${top})`;

<g className={'series'} transform={transform}>
  {children}
</g>
Native SVG covers the main translation behavior with 0 package imports. Prefer it when the application does not otherwise use visx conventions.
Alternatives
| Package | Registry | Pick it when |
|---|---|---|
| recharts | npm | Use it for composed React charts with axes, legends, tooltips, responsiveness, and animation included. |
| victory | npm | Use it when a declarative React chart suite fits better than assembling SVG primitives. |
| d3-selection | npm | Use it when D3 rather than React owns SVG elements, data joins, and DOM updates. |
More web frontend guides
postcss · react · react-dom · tailwindcss · htmlparser2 · tailwind-merge · the whole shelf →
How this guide is made: grounded in the library's documentation, release notes, changelog, and issue history, on a fixed rubric — not a hands-on install of every release. The 50 most-downloaded entries are additionally install-verified in clean containers. Corrections: contact the desk.