python-pptx review
python-pptx 1.0.2 reads, creates, and edits PowerPoint Open XML files without launching Office. Code can add template layouts, fill placeholders, format runs and paragraphs, position images and shapes, create tables, and write charts that remain editable in PowerPoint. It can also extract text and media from existing decks. The API mirrors the document hierarchy: a presentation has slides, slides have shapes, and text frames hold paragraphs and runs. Our import worked in 0.78 seconds and the package included typing metadata. Version 1.0.2 restores read-only enum members after 1.0.0 introduced annotations and parsing fixes.
python-pptx 1.0.2 imported in 0.78 seconds after our 0.4-second install, which used 34 MB across five packages and produced 0 audit findings. It is a sound fit for template-led editable decks, but skip it when rendering, animation, supported slide deletion, or active upstream releases are mandatory.
We installed it
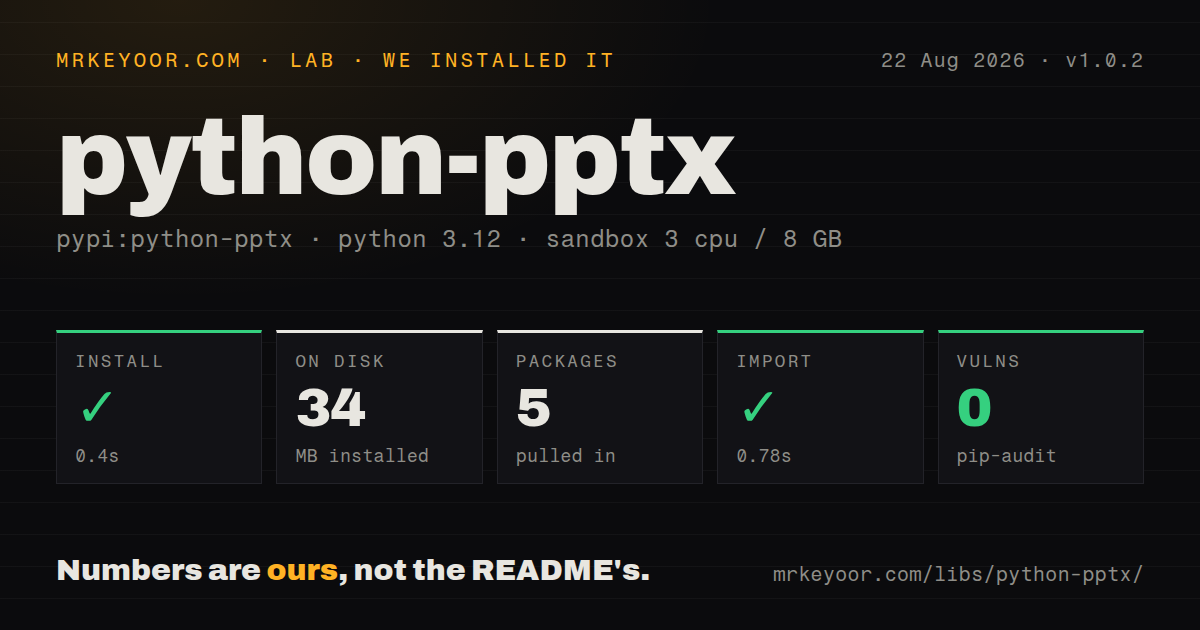
| Install | ✓ · 0.4s | 5 packages on disk · 34 MB |
| Import | ✓ | import pptx in 0.78s · pure Python · py.typed · requires Python >=3.8 |
| Known vulns | 0 | (pip-audit) |
Answers from our run
Does python-pptx install cleanly?
Yes. In a fresh container with an empty cache, pip install python-pptx finished in 0.4s, leaving 5 packages and 34 MB on disk. pip-audit reported no known vulnerabilities.
What does python-pptx need to run?
Python >=3.8, and nothing compiled: it is pure Python. In our run import pptx succeeded in 0.78s, and the package ships py.typed for type checkers.
python-pptx or aspose-slides: which should you use?
aspose-slides: Use it when rendering and broader PowerPoint feature coverage justify a commercial license review. python-pptx 1.0.2 imported in 0.78 seconds after our 0.4-second install, which used 34 MB across five packages and produced 0 audit findings.
When should you not use python-pptx?
The deliverable is PDF or slide images. python-pptx writes package XML and has no rendering engine.
Use it if
- A Python reporting job must produce editable PowerPoint decks from analytics or database results.
- A designer supplies a branded `.pptx`, and generated slides should reuse its layouts, masters, placeholders, and theme.
- You need to extract slide text, table values, or images for indexing and migration.
- Generation runs on Linux or another machine where Microsoft PowerPoint is unavailable.
- The deliverable is PDF or slide images. python-pptx writes package XML and has no rendering engine.
- Animations, transitions, SmartArt editing, or 3D chart authoring are required; the public API does not cover them.
- Deleting, cloning, and arbitrary slide reordering must use supported methods. Common recipes reach into private relationships.
- You cannot begin with a prepared layout. `add_slide()` selects from layouts already stored in the opened presentation.
- Text tokens must preserve mixed run formatting exactly. PowerPoint can split one visible token across several runs, making replacement lossy.
- Recent upstream fixes are a requirement. Both the last release and repository push were in August 2024, with 534 open issues and pull requests now reported.
Setup reality
We installed python-pptx 1.0.2 in a fresh Python 3.12 Bookworm sandbox. pip completed in 0.4 seconds, leaving five packages that occupied 34 MB. pip-audit found 0 known vulnerabilities. Our inspection recorded four direct dependencies, a Python 3.8 floor, pure Python code, py.typed, and an MIT license. import pptx succeeded in 0.78 seconds.
There are no credentials or library config files, but a production generator usually needs a versioned template. Open the branded .pptx, then enumerate its layout names and placeholder IDs. Both values are defined by that file; copying an index from a tutorial or another template can select a different layout or fail. For a blank presentation, set slide width and height before calculating coordinates because existing shapes do not resize when the canvas changes.
Geometry uses English Metric Units, with Inches, Cm, and Pt helpers for readable code. Text is divided among text frames, paragraphs, and runs. Assigning text_frame.text replaces paragraph content, while PowerPoint may split a placeholder such as {{total}} across differently formatted runs. Joining the runs finds it, but writing the result into one run flattens the formatting that distinguished the others. Template tests need samples with hyperlinks, mixed fonts, tables, charts, and groups.
Saving produces a .pptx ZIP package, not a visual rendering. PDF or PNG output requires PowerPoint, LibreOffice, or another renderer and separate font-fidelity testing. Native charts store data in an embedded workbook. Extractors must recurse into grouped shapes and inspect notes separately. Version 1.0.2 has seen no published successor since 2024, so pin it and isolate any private slide-delete or reorder helper behind regression tests that reopen the saved deck.
Patterns
Create a title slide and save it create-first-deck
from pptx import Presentation

prs = Presentation()
slide = prs.slides.add_slide(prs.slide_layouts[0])   # 0 = title slide
slide.shapes.title.text = "Q3 Review"
slide.placeholders[1].text = "Generated automatically"

prs.save("deck.pptx")
Layout index 0 belongs to the opened template; enumerate names before relying on it in a supplied deck.
Set a widescreen canvas before layout widescreen-slides
from pptx import Presentation
from pptx.util import Inches

prs = Presentation()
prs.slide_width = Inches(13.333)
prs.slide_height = Inches(7.5)
Set the canvas before adding shapes because later size changes do not scale or reposition existing objects.
List a template’s layouts and placeholders inspect-a-template
from pptx import Presentation

prs = Presentation("brand-template.pptx")
for i, layout in enumerate(prs.slide_layouts):
    print(i, layout.name)
    for ph in layout.placeholders:
        print("   idx", ph.placeholder_format.idx,
              ph.placeholder_format.type, ph.name)
Placeholder `idx` is stored in the file and is not the placeholder list position; tie it to the template version.
Write nested bullet paragraphs bulleted-text
from pptx import Presentation
from pptx.util import Pt

prs = Presentation()
slide = prs.slides.add_slide(prs.slide_layouts[1])
slide.shapes.title.text = "Findings"

tf = slide.placeholders[1].text_frame
tf.text = "Top level bullet"          # replaces paragraph 0

p = tf.add_paragraph()
p.text = "Second level"
p.level = 1

p = tf.add_paragraph()
p.text = "Emphasised"
p.level = 2
p.font.bold = True
p.font.size = Pt(16)
Set the first paragraph before adding others, since assigning `text_frame.text` replaces existing paragraph content.
Place pictures without changing aspect ratio add-picture
from pptx import Presentation
from pptx.util import Inches

prs = Presentation()
slide = prs.slides.add_slide(prs.slide_layouts[6])   # blank

# give exactly one dimension and aspect ratio is preserved
slide.shapes.add_picture("chart.png", Inches(1), Inches(1), width=Inches(6))

# from a file-like object works too
with open("logo.png", "rb") as f:
    slide.shapes.add_picture(f, Inches(8), Inches(0.5), height=Inches(0.75))
Giving one dimension preserves aspect ratio; giving both can distort the image.
Create a fixed-size PowerPoint table add-table
from pptx import Presentation
from pptx.util import Inches

prs = Presentation()
slide = prs.slides.add_slide(prs.slide_layouts[5])   # title only

rows, cols = 3, 2
table = slide.shapes.add_table(
    rows, cols, Inches(1), Inches(2), Inches(8), Inches(1.5)
).table

table.columns[0].width = Inches(5)
table.columns[1].width = Inches(3)
table.cell(0, 0).text = "Metric"
table.cell(0, 1).text = "Value"
table.cell(1, 0).text = "Signups"
table.cell(1, 1).text = "1,204"
`add_table()` returns a graphic frame, and row and column counts cannot be changed after creation.
Build an editable native chart add-chart
from pptx import Presentation
from pptx.chart.data import CategoryChartData
from pptx.enum.chart import XL_CHART_TYPE
from pptx.util import Inches

prs = Presentation()
slide = prs.slides.add_slide(prs.slide_layouts[5])

data = CategoryChartData()
data.categories = ["East", "West", "Midwest"]
data.add_series("Q1", (19.2, 21.4, 16.7))
data.add_series("Q2", (22.3, 28.6, 15.2))

frame = slide.shapes.add_chart(
    XL_CHART_TYPE.COLUMN_CLUSTERED,
    Inches(2), Inches(2), Inches(6), Inches(4.5), data
)
chart = frame.chart
chart.has_legend = True
PowerPoint stores the series data in an embedded workbook, so validate both the visible chart and its editable data.
Style an autoshape fill and outline shape-fill-and-color
from pptx import Presentation
from pptx.dml.color import RGBColor
from pptx.enum.shapes import MSO_SHAPE
from pptx.util import Inches

prs = Presentation()
slide = prs.slides.add_slide(prs.slide_layouts[5])

shape = slide.shapes.add_shape(
    MSO_SHAPE.ROUNDED_RECTANGLE,
    Inches(1), Inches(2), Inches(2.5), Inches(1)
)
shape.text = "Step 1"
shape.fill.solid()
shape.fill.fore_color.rgb = RGBColor(0x1F, 0x77, 0xB4)
shape.line.color.rgb = RGBColor(0xFF, 0xFF, 0xFF)
Call `solid()` before setting the foreground; explicit RGB colors stop following template theme changes.
Extract text and table cells extract-all-text
from pptx import Presentation

prs = Presentation("input.pptx")
for n, slide in enumerate(prs.slides, start=1):
    for shape in slide.shapes:
        if shape.has_text_frame:
            for para in shape.text_frame.paragraphs:
                text = "".join(run.text for run in para.runs)
                if text.strip():
                    print(n, text)
        if shape.has_table:
            for row in shape.table.rows:
                print(n, [c.text for c in row.cells])
Grouped shapes contain another shape collection, and speaker notes live on separate notes slides.
Replace tokens that span runs find-and-replace
def replace_text(prs, mapping):
    for slide in prs.slides:
        for shape in slide.shapes:
            if not shape.has_text_frame:
                continue
            for para in shape.text_frame.paragraphs:
                full = "".join(r.text for r in para.runs)
                new = full
                for k, v in mapping.items():
                    new = new.replace(k, str(v))
                if new != full and para.runs:
                    para.runs[0].text = new
                    for r in para.runs[1:]:
                        r.text = ""
This catches tokens split across runs but applies the first run style to the replacement and clears later formatting.
Remove a slide through package internals delete-a-slide
R_NS = "{http://schemas.openxmlformats.org/officeDocument/2006/relationships}id"

def delete_slide(prs, index):
    id_list = prs.slides._sldIdLst
    entries = list(id_list)
    rId = entries[index].get(R_NS)
    prs.part.drop_rel(rId)
    id_list.remove(entries[index])
This relies on private package relationships because 1.0.2 has no public delete method; reopen the saved file in tests.
Write a deck into an HTTP response buffer save-to-memory
from io import BytesIO
from pptx import Presentation

def build_deck() -> bytes:
    prs = Presentation("brand-template.pptx")
    prs.slides.add_slide(prs.slide_layouts[0]).shapes.title.text = "Report"

    buf = BytesIO()
    prs.save(buf)
    buf.seek(0)
    return buf.getvalue()

# content type:
# application/vnd.openxmlformats-officedocument.presentationml.presentation
Rewind the buffer before streaming and send the Open XML presentation content type.
Alternatives
| Package | Registry | Pick it when |
|---|---|---|
| aspose-slides | PyPI | Use it when rendering and broader PowerPoint feature coverage justify a commercial license review. |
| reportlab | PyPI | Use it when the output should be a drawn PDF rather than an editable slide deck. |
| python-docx | PyPI | Use it for flowing Word documents instead of coordinate-positioned slides. |
More utils guides
lru-cache · ajv · type-fest · p-limit · find-up · js-yaml · the whole shelf →
How this guide is made: grounded in the library's documentation, release notes, changelog, and issue history, on a fixed rubric — not a hands-on install of every release. The 50 most-downloaded entries are additionally install-verified in clean containers. Corrections: contact the desk.