pydeck review
pydeck 0.9.3 lets Python describe deck.gl layers, camera state, basemaps, and tooltips, then serializes that description and its records for a browser to render with WebGL. It covers point clouds, arcs, paths, polygons, heatmaps, hexagon aggregation, and animated-trip specifications without requiring a React application. The GPU draws the result, but Python and the browser still pay to serialize, transfer, and parse the data. It is a map renderer, not a GIS analysis package or a headless image engine.
pydeck 0.9.3 installed in 0.7 seconds and imported in 0.67 seconds, but its 4-package environment occupied 81 MB in our sandbox. Use it when the deliverable is an interactive deck.gl map; choose another tool for headless images, spatial analysis, Python callbacks, or offline provider tiles.
We installed it
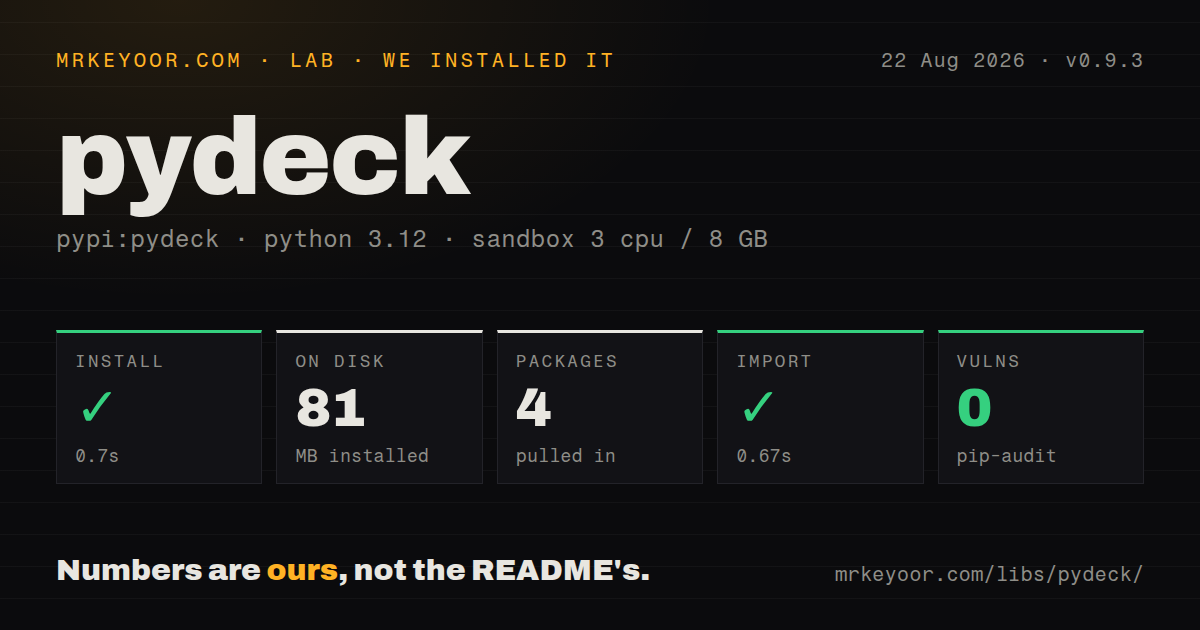
| Install | ✓ · 0.7s | 4 packages on disk · 81 MB |
| Import | ✓ | import pydeck in 0.67s · pure Python · requires Python >=3.8 |
| Known vulns | 0 | (pip-audit) |
Answers from our run
Does pydeck install cleanly?
Yes. In a fresh container with an empty cache, pip install pydeck finished in 0.7s, leaving 4 packages and 81 MB on disk. pip-audit reported no known vulnerabilities.
What does pydeck need to run?
Python >=3.8, and nothing compiled: it is pure Python. In our run import pydeck succeeded in 0.67s.
pydeck or plotly: which should you use?
plotly: Choose it when maps sit beside statistical charts and static image export is part of the deliverable. pydeck 0.9.3 installed in 0.7 seconds and imported in 0.67 seconds, but its 4-package environment occupied 81 MB in our sandbox.
When should you not use pydeck?
The output must be PNG, SVG, or a publication figure rendered on a headless server. pydeck's normal result needs a browser and WebGL.
Use it if
- A Python workflow needs an interactive WebGL map with point, polygon, path, heatmap, hexagon, or trip layers.
- Notebook users should produce the same deck.gl layer model that a browser application understands.
- An interactive HTML deliverable is useful and building a separate React frontend would be wasted work.
- The team already knows deck.gl accessors and wants their Python spelling rather than another chart grammar.
- The output must be PNG, SVG, or a publication figure rendered on a headless server. pydeck's normal result needs a browser and WebGL.
- Every hover or click must call Python immediately. Serialized deck.gl interaction is not the same as a permanent Python event loop.
- The map must work offline with a provider basemap. Style documents and tiles can remain remote and may require credentials even when overlay records are embedded.
- Millions of raw rows will be embedded in one HTML file. GPU drawing cannot remove Python serialization, download, JSON parsing, or browser memory costs.
- The task is reprojection, spatial joins, topology repair, or geocoding. Prepare that data with GIS tools before handing coordinates to pydeck.
Setup reality
We installed pydeck 0.9.3 in a fresh Python 3.12 Bookworm sandbox in 0.7 seconds. The result was 4 packages and 81 MB on disk, with 0 known vulnerabilities from pip-audit. PyPI requires Python 3.8 or newer. The package is pure Python, declares 6 direct dependencies, has no py.typed marker, and completed import pydeck in 0.67 seconds.
The rendered artifact is JavaScript in a WebGL-capable browser. Jupyter, VS Code notebooks, Colab, Streamlit, and exported HTML use different display plumbing, CSP rules, and persistence behavior. Test the actual destination instead of treating a successful Python import as proof that the map can display. If widget versions conflict, inspect the notebook environment before adding the published Jupyter extra.
Basemap setup is separate from overlay layers. A provider style can need a token and network access; a blank background may come from credentials, CSP, WebGL support, or tile access while the data layer itself is valid. Set map_style=None when the overlay can stand alone. Tooltip HTML receives serialized row values in the browser, so escape or sanitize untrusted content.
Accessor strings such as [lon, lat] are evaluated by deck.gl against each serialized row, not by Python. Coordinates normally use longitude first, while radius, width, and elevation units depend on the chosen layer property. Large frames can swamp notebook messages and exported files before GPU drawing begins. Aggregate in Python or use the documented URL or binary transports when payload size, not rendering, is the bottleneck.
Patterns
Render a basic scatterplot map scatterplot-map
import pydeck as pdk

data = [{'lon': -122.4, 'lat': 37.78, 'count': 120}]
layer = pdk.Layer(
    'ScatterplotLayer', data,
    get_position='[lon, lat]', get_radius=100,
    get_fill_color=[30, 136, 229, 180], pickable=True,
)
deck = pdk.Deck(layers=[layer], initial_view_state=pdk.ViewState(
    longitude=-122.4, latitude=37.78, zoom=11
))
deck.show()
The accessor reads longitude before latitude from each serialized row; deck.gl evaluates it in the browser.
Show row fields in a tooltip add-tooltip
deck = pdk.Deck(
    layers=[layer],
    initial_view_state=view_state,
    tooltip={'html': '<b>{name}</b><br/>Count: {count}', 'style': {'color': 'white'}},
)
Tooltip placeholders expose browser-side row fields. Sanitize untrusted strings before placing them in HTML.
Aggregate dense points into hexagons aggregate-hexagons
hexes = pdk.Layer(
    'HexagonLayer', data,
    get_position='[lon, lat]',
    radius=250, elevation_scale=20,
    extruded=True, pickable=True,
)
The browser performs aggregation, but every raw point must still be serialized, transferred, parsed, and stored.
Draw GeoJSON polygons and lines draw-geojson
geo = pdk.Layer(
    'GeoJsonLayer', geojson,
    filled=True, stroked=True, pickable=True,
    get_fill_color=[0, 128, 255, 90],
    get_line_color=[20, 20, 20],
    line_width_min_pixels=1,
)
Supply WGS84 longitude and latitude. pydeck will not reproject the GeoJSON for this layer.
Connect origins and destinations with arcs connect-points-with-arcs
arcs = pdk.Layer(
    'ArcLayer', trips,
    get_source_position='source',
    get_target_position='target',
    get_source_color=[0, 180, 255],
    get_target_color=[255, 80, 80],
    get_width=3, pickable=True,
)
Both endpoints must already be two-number coordinate arrays ordered as longitude, latitude.
Render routes with PathLayer render-paths
paths = pdk.Layer(
    'PathLayer', routes,
    get_path='path', get_color='color',
    width_scale=4, width_min_pixels=2,
    get_width=2, pickable=True,
)
Simplify detailed routes before export when JSON size matters more than GPU drawing speed.
Create a weighted heatmap visualize-heatmap
heat = pdk.Layer(
    'HeatmapLayer', points,
    get_position='[longitude, latitude]',
    get_weight='magnitude',
    radius_pixels=40,
)
`radius_pixels` is measured on screen rather than on Earth, so the heat footprint changes with zoom.
Render timestamped moving paths animate-trips
trips_layer = pdk.Layer(
    'TripsLayer', trips,
    get_path='waypoints.map(d => d.coordinates)',
    get_timestamps='waypoints.map(d => d.timestamp)',
    get_color=[253, 128, 93],
    current_time=500, trail_length=180,
)
A static Python export does not advance `current_time`; a frontend or widget must update that property.
Choose a basemap style set-map-style
deck = pdk.Deck(
    layers=[layer],
    initial_view_state=view_state,
    map_style='light',
)
Basemap availability and credentials belong to the selected provider, independent of the overlay layer.
Render layers without map tiles render-without-basemap
deck = pdk.Deck(
    layers=[layer],
    initial_view_state=view_state,
    map_style=None,
)
Removing the style removes provider tiles and tokens. Add geographic context through your own layers if users still need it.
Write an interactive HTML file export-html
deck.to_html(
    'map.html',
    open_browser=False,
    notebook_display=False,
)
Embedded records can make this file large, and any remote style or tiles still require network access.
Set camera bearing and pitch fit-camera-manually
view_state = pdk.ViewState(
    longitude=-73.98, latitude=40.75,
    zoom=10, pitch=45, bearing=-20,
)
deck = pdk.Deck(layers=[layer], initial_view_state=view_state)
`ViewState` sets one starting camera. Compute bounds yourself when datasets arrive with different extents.
Alternatives
| Package | Registry | Pick it when |
|---|---|---|
| plotly | PyPI | Choose it when maps sit beside statistical charts and static image export is part of the deliverable. |
| folium | PyPI | Choose it for Leaflet maps, markers, and plugins without deck.gl's GPU layer model. |
| lonboard | PyPI | Choose it for notebook maps built around GeoArrow transport and large geospatial tables. |
More data guides
numpy · fsspec · pandas · sqlalchemy · pyarrow · lxml · the whole shelf →
How this guide is made: grounded in the library's documentation, release notes, changelog, and issue history, on a fixed rubric — not a hands-on install of every release. The 50 most-downloaded entries are additionally install-verified in clean containers. Corrections: contact the desk.