py-spy review
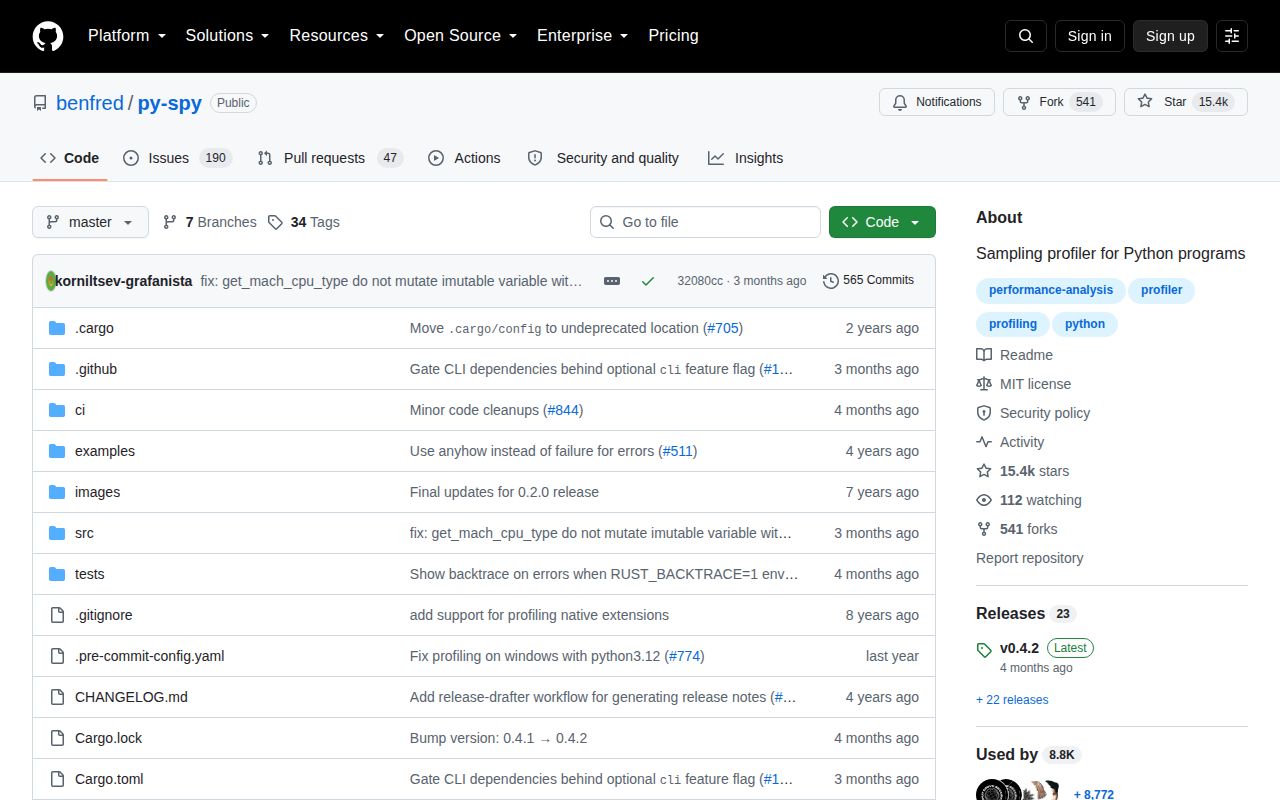
py-spy 0.4.2 is a standalone sampling profiler that reads CPython interpreter memory from another process. It can attach to a PID or launch Python itself, then show a live top view, dump thread stacks, or record flamegraph, speedscope, raw, and Chrome trace files without importing profiler code into the target. Version 0.4.2 adds CPython 3.14 detection, native-stack support on Linux AArch64, Rust backtraces for profiler errors, a fix for macOS universal binary symbols, and corrected subprocess output. Our Python import check failed, which fits a command-line executable rather than an application library.
py-spy 0.4.2 installed in 0.2 seconds and used 1 MB with 0 audit findings in our sandbox, but its Python import check failed because the useful interface is the `py-spy` executable. Keep it for live CPython incidents where process-memory access is approved; do not grant permanent elevated privileges merely to make routine profiling convenient.
We installed it
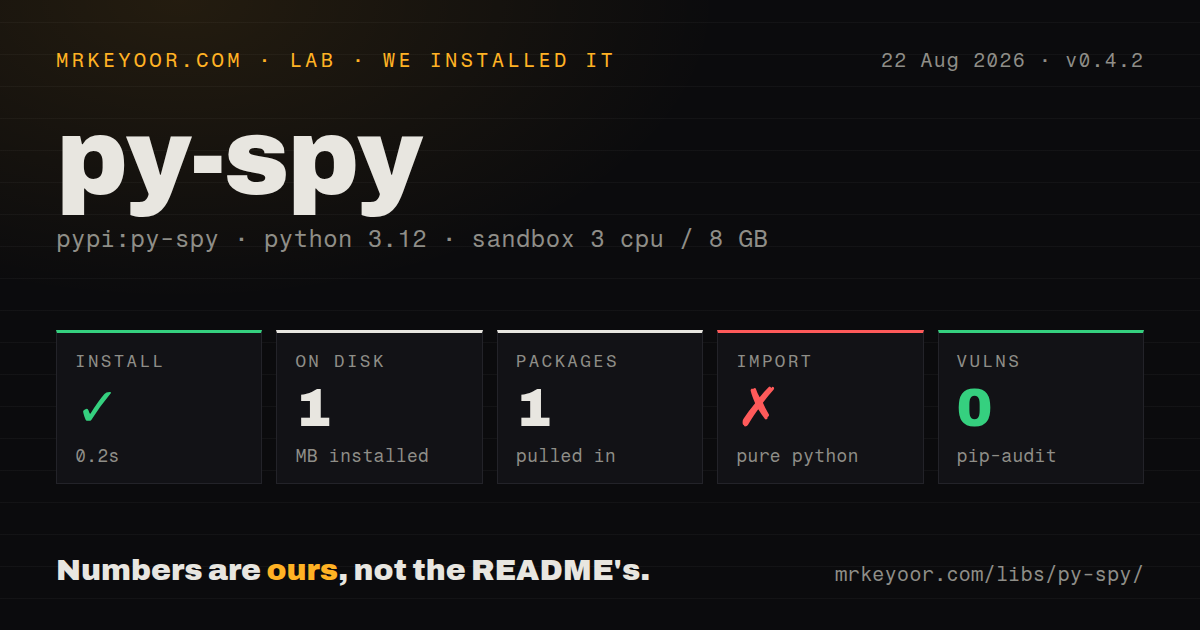
| Install | ✓ · 0.2s | 1 package on disk · 1 MB |
| Import | ✗ | import py-spy · compiled extensions |
| Known vulns | 0 | (pip-audit) |
Answers from our run
Does py-spy install cleanly?
Yes. In a fresh container with an empty cache, pip install py-spy finished in 0.2s, leaving 1 package and 1 MB on disk. pip-audit reported no known vulnerabilities.
What does py-spy need to run?
Python 3.x, and a platform wheel with compiled extensions. In our run import py-spy failed, so it needs extra system packages.
py-spy or scalene: which should you use?
scalene: Use Scalene for line-level CPU and memory attribution when the program can start under the profiler. py-spy 0.4.2 installed in 0.2 seconds and used 1 MB with 0 audit findings in our sandbox, but its Python import check failed because the useful interface is the py-spy executable.
When should you not use py-spy?
You need exact call counts, deterministic timings, or line-level memory attribution. Sampling can miss short and rare work, while Scalene or tracing tools answer different questions.
Use it if
- A running CPython service needs CPU evidence without a code change or restart.
- You need a 30-second flamegraph, an interactive top view, or a one-shot stack dump from a process ID.
- Gunicorn or multiprocessing children must be followed from the parent process with `--subprocesses`.
- The incident permits the process-memory access required by the host, container, or Kubernetes security policy.
- You need exact call counts, deterministic timings, or line-level memory attribution. Sampling can miss short and rare work, while Scalene or tracing tools answer different questions.
- The environment cannot grant process-memory access. Existing Linux PIDs commonly need ptrace permission, macOS generally needs root, and containers often need `SYS_PTRACE`.
- Native-extension frames must work on every platform. The README limits `--native` to named operating-system and architecture combinations and recommends debug symbols.
- The target is PyPy, 32-bit Windows, or another unsupported interpreter and platform combination listed by the project.
- Profile artifacts cannot contain sensitive paths, command lines, thread names, or local values. `dump --locals` can expose application data directly.
Setup reality
We installed py-spy 0.4.2 in a fresh Python 3.12 Bookworm sandbox. pip finished in 0.2 seconds, left 1 package using 1 MB on disk, and installed 1 direct dependency. pip-audit found 0 known vulnerabilities. The distribution includes compiled .so code, declares no Python version floor, and has no py.typed marker. Our import check failed; use the py-spy executable instead of importing it into application code.
Attaching is the setup cost. On Linux, a profiler-created child often works without root, while an unrelated PID is usually blocked by ptrace_scope unless ownership and permission allow it. macOS generally requires root, and System Integrity Protection blocks /usr/bin Python even then. Docker and Kubernetes normally drop SYS_PTRACE, so adding that capability changes the workload security posture.
Prebuilt wheels cover several mainstream systems. A Cargo source install needs Rust and libunwind development files on Linux or Windows. Alpine does not accept normal manylinux wheels; upstream documents its testing package and musl release binaries. Version 0.4.2 supports CPython through 3.14, but wheel availability, native-frame support, and interpreter recognition are separate checks.
Normal sampling briefly pauses the target for a consistent stack read. --nonblocking avoids that pause but can return partial stacks or more sampling errors and cannot be combined with --native. Bound production recordings with --duration; the default rate is 100 samples per second. Use --subprocesses from the start for worker pools, and protect output files because thread names, paths, commands, and --locals values may contain secrets.
Patterns
Capture a bounded flamegraph record-pid
py-spy record --pid 12345 --duration 30 --output profile.svgAttaching to an existing PID commonly needs ptrace permission on Linux and elevated access on macOS. The recording runs for 30 seconds.
Launch a process under py-spy profile-command
py-spy record --output profile.svg -- python -m myservice.workerA process launched by py-spy is its child, which often avoids the Linux permission barrier applied to unrelated PIDs.
Refresh a live hot-function view watch-top
py-spy top --pid 12345 --delay 1.0`top` updates every 1 second until stopped and does not create a shareable profile file.
Take one thread snapshot dump-stacks
py-spy dump --pid 12345`dump` captures one moment across Python threads. Repeat it when diagnosing an intermittent hang.
Save stack data as JSON dump-json
py-spy dump --pid 12345 --json > stacks.jsonJSON is available for `dump` output in 0.4.2. The file can include process and stack details that deserve incident-artifact controls.
Include frame local variables dump-locals
py-spy dump --pid 12345 --locals`--locals` can expose tokens, personal data, queries, and message bodies. A second `-l` increases local-value verbosity.
Write a speedscope profile record-speedscope
py-spy record --pid 12345 --duration 60 --format speedscope --output profile.jsonThe 60-second JSON opens in speedscope. Use flamegraph when a standalone interactive SVG is easier to pass around.
Write a Chrome trace record-chrome-trace
py-spy record --pid 12345 --duration 30 --format chrometrace --output profile.json`chrometrace` is one of 4 formats accepted by 0.4.2. Load the JSON in a compatible trace viewer.
Profile new subprocesses follow-workers
py-spy record --pid 12345 --subprocesses --duration 60 --output workers.svg`--subprocesses` follows children created during the run and records process identifiers and command information with their stacks.
Add supported native frames include-native
py-spy record --pid 12345 --native --duration 30 --output native.svgNative frames require a supported platform and work best with symbols. Version 0.4.2 adds Linux AArch64 support.
Keep only GIL-holding samples filter-gil
py-spy record --pid 12345 --gil --duration 30 --output gil.svg`--gil` excludes active extension code while that code has released the GIL, so it answers a narrower CPU question.
Avoid pausing the target sample-nonblocking
py-spy record --pid 12345 --nonblocking --duration 30 --output nonblocking.svgNonblocking reads can produce partial frames and more sample errors. Version 0.4.2 forbids combining this option with `--native`.
Alternatives
| Package | Registry | Pick it when |
|---|---|---|
| scalene | PyPI | Use Scalene for line-level CPU and memory attribution when the program can start under the profiler. |
| viztracer | PyPI | Use VizTracer when a detailed event timeline and interactive trace viewer matter more than external attachment. |
| pyinstrument | PyPI | Use pyinstrument for friendly in-process statistical profiles of scripts, requests, and notebooks. |
More infra guides
boto3 · opentelemetry-api · psutil · distro · @opentelemetry/api · google-cloud-storage · the whole shelf →
How this guide is made: grounded in the library's documentation, release notes, changelog, and issue history, on a fixed rubric — not a hands-on install of every release. The 50 most-downloaded entries are additionally install-verified in clean containers. Corrections: contact the desk.