prometheus-client review
prometheus-client 0.26.0 is the official Python instrumentation package for exporting Prometheus and OpenMetrics data. Counter, Gauge, Histogram, Summary, Info, and Enum objects register samples that can be served over HTTP, mounted in WSGI or ASGI, written for node_exporter, or sent to a Pushgateway. Version 0.26 makes Timer context duration readable, adds TLS-version controls to the WSGI server, validates Enum states before collector registration, and fixes duplicate-series errors, exemplars, native histogram sums, and collector unregister behavior.
prometheus-client 0.26.0 installed in 0.3 seconds and used 1 MB in our sandbox, making package cost negligible compared with the label and multiprocess design work. Install it for Prometheus-native Python metrics, but walk away when cardinality is uncontrolled or a prefork deployment cannot manage shared metric files.
We installed it
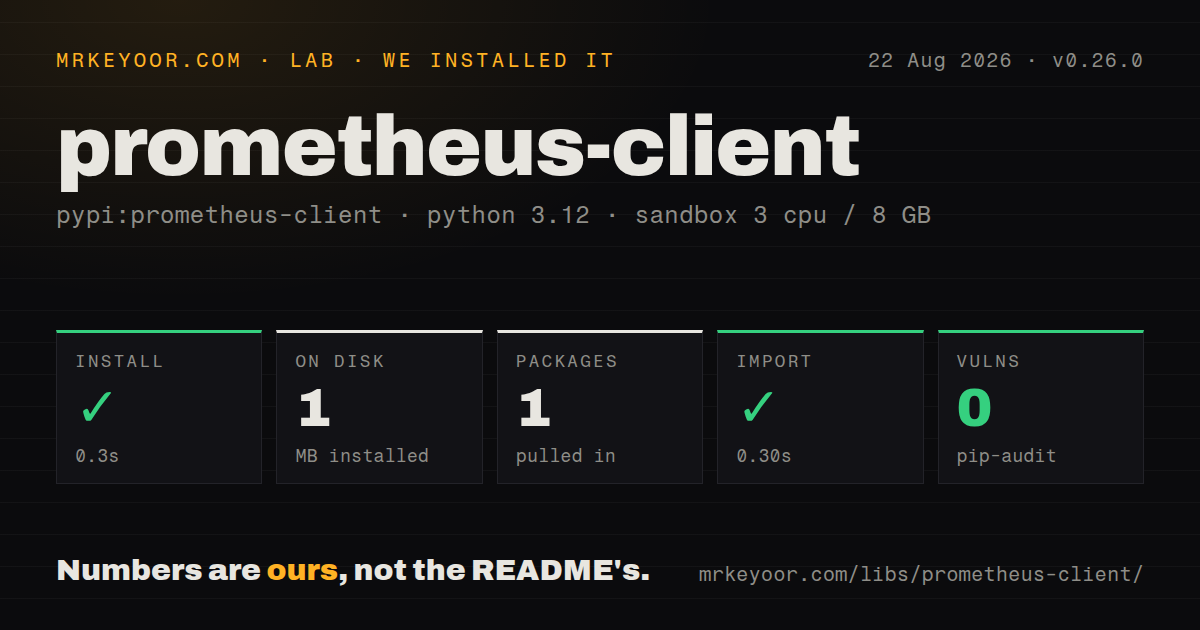
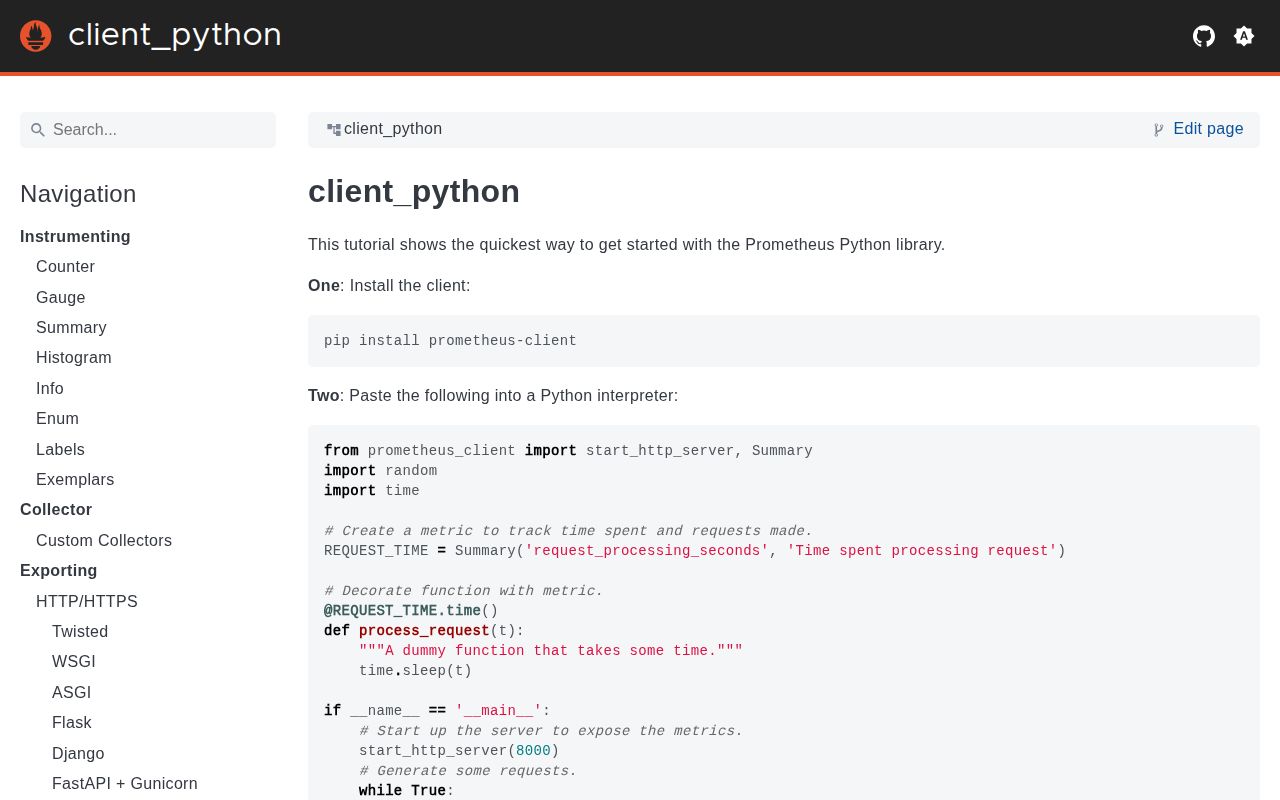
| Install | ✓ · 0.3s | 1 package on disk · 1 MB |
| Import | ✓ | import prometheus_client in 0.30s · pure Python · py.typed · requires Python >=3.9 |
| Known vulns | 0 | (pip-audit) |
Answers from our run
Does prometheus-client install cleanly?
Yes. In a fresh container with an empty cache, pip install prometheus-client finished in 0.3s, leaving 1 package and 1 MB on disk. pip-audit reported no known vulnerabilities.
What does prometheus-client need to run?
Python >=3.9, and nothing compiled: it is pure Python. In our run import prometheus_client succeeded in 0.30s, and the package ships py.typed for type checkers.
prometheus-client or opentelemetry-api: which should you use?
Pick opentelemetry-api when opentelemetry-api 1.x fits when one vendor-neutral API should cover metrics and distributed tracing. prometheus-client 0.26.0 installed in 0.3 seconds and used 1 MB in our sandbox, making package cost negligible compared with the label and multiprocess design work.
When should you not use prometheus-client?
A prefork deployment cannot create and clear PROMETHEUS_MULTIPROC_DIR or mark dead workers. Normal in-memory registries do not merge themselves across processes.
Use it if
- prometheus-client 0.26.0 fits a Python service whose metrics will be scraped by Prometheus or an OpenMetrics-compatible collector.
- Request counts and latency distributions need explicit labels and Histogram buckets owned by application code.
- A batch process can publish through node_exporter's textfile collector or a deliberately managed Pushgateway group.
- The deployment can follow the package's separate multiprocess setup for Gunicorn or another prefork server.
- A prefork deployment cannot create and clear PROMETHEUS_MULTIPROC_DIR or mark dead workers. Normal in-memory registries do not merge themselves across processes.
- You require client-calculated quantiles from Summary. The Python client exports count and sum; use Histogram buckets and PromQL for quantiles.
- Labels would contain user IDs, request IDs, raw URLs, timestamps, or another unbounded dimension. Each unique label set creates a time series.
- OpenTelemetry already owns metrics, traces, exporters, and naming in the service. A second instrumentation API can duplicate series and configuration.
- A short batch exits before any scrape and nobody owns stale Pushgateway cleanup or a node_exporter textfile directory.
- Scraping must trigger slow database or network calls. set_function and custom collectors run during collection and can delay the entire metrics response.
Setup reality
We installed prometheus-client 0.26.0 in a fresh Python 3.12 Bookworm sandbox. The install completed in 0.3 seconds, left 1 package, and used 1 MB. pip-audit found 0 known vulnerabilities. Package metadata reports 3 direct dependencies, Python >=3.9, and pure Python code. import prometheus_client worked in 0.30 seconds. The distribution includes py.typed, while the measured license field was unknown.
Metric names enter the default registry at import time in many applications. Importing the same module through two paths or recreating a metric with the same name raises a duplicate-series error. Tests are easier with a private CollectorRegistry. Labels are schema, not decoration: every label must be supplied, and every distinct combination persists as a series. Use route templates and bounded status or operation values.
start_http_server opens a metrics endpoint in its own thread; make_asgi_app and make_wsgi_app mount exposition inside an application. Neither adds authentication. Bind to a private interface, protect the route at the proxy, or let an in-host agent scrape it. Histograms require buckets chosen for the service's latency or size range. Version 0.26 exposes a Timer context's measured duration, but it does not repair poor buckets.
Multiprocess mode writes per-process metric files under PROMETHEUS_MULTIPROC_DIR. Set that variable before Python imports the client, clear the directory between deployments, collect through MultiProcessCollector, and call mark_process_dead from the worker-exit hook. Several features have multiprocess limits, including custom collectors and some Gauge behavior. Pushgateway values also outlive the process, so jobs need stable grouping keys and an explicit deletion policy.
Patterns
Count requests with bounded labels count-requests
from prometheus_client import Counter

REQUESTS = Counter('app_requests_total', 'Completed requests', ['method', 'route', 'status'])
REQUESTS.labels('GET', '/items/{id}', '200').inc()
Use /items/{id}, not the raw URL. Object IDs would create one time series per item.
Observe latency in chosen buckets time-operation
from prometheus_client import Histogram

LATENCY = Histogram('app_job_duration_seconds', 'Job duration', ['kind'], buckets=(0.1, 0.5, 1, 2.5, 5, 10))
with LATENCY.labels('import').time() as timer:
    import_rows()
print(timer.duration)
Version 0.26 exposes timer.duration after the context exits. PromQL quantile usefulness still depends on these bucket boundaries.
Track active work through exceptions track-in-progress
from prometheus_client import Gauge

ACTIVE = Gauge('app_tasks_in_progress', 'Tasks currently running')
with ACTIVE.track_inprogress():
    run_task()
The context decrements the Gauge when run_task raises, preventing an exception from leaving a false active count.
Serve metrics on loopback serve-metrics
from prometheus_client import start_http_server

server, thread = start_http_server(8000, addr='127.0.0.1')
run_worker()
The endpoint has no built-in authentication. Loopback is suitable when a local agent performs the scrape.
Mount an ASGI metrics route mount-asgi
from fastapi import FastAPI
from prometheus_client import make_asgi_app

app = FastAPI()
app.mount('/metrics', make_asgi_app())
Several application workers need multiprocess mode; separate in-memory registries otherwise expose per-worker values.
Test with an isolated registry test-registry
from prometheus_client import CollectorRegistry, Counter

registry = CollectorRegistry()
failures = Counter('app_failures_total', 'Failed operations', ['kind'], registry=registry)
failures.labels('timeout').inc()
assert registry.get_sample_value('app_failures_total', {'kind': 'timeout'}) == 1.0
A private registry prevents module-level metrics from colliding across tests or import order.
Publish one batch result atomically write-textfile
from prometheus_client import CollectorRegistry, Gauge, write_to_textfile

registry = CollectorRegistry()
last_success = Gauge('batch_last_success_timestamp_seconds', 'Last success', registry=registry)
last_success.set_to_current_time()
write_to_textfile('/var/lib/node_exporter/textfile_collector/import.prom', registry)
The path must be inside node_exporter's configured textfile directory. A temporary file plus rename replaces the output atomically.
Merge prefork worker metric files collect-multiprocess
from prometheus_client import CollectorRegistry, generate_latest, multiprocess

def render_metrics():
    registry = CollectorRegistry()
    multiprocess.MultiProcessCollector(registry)
    return generate_latest(registry)
PROMETHEUS_MULTIPROC_DIR must exist before client import and be cleared for each deployment. Mark worker pids dead on exit.
Alternatives
| Package | Registry | Pick it when |
|---|---|---|
| opentelemetry-api | PyPI | opentelemetry-api 1.x fits when one vendor-neutral API should cover metrics and distributed tracing. |
| statsd | PyPI | Use statsd for fire-and-forget UDP metrics to an existing StatsD-compatible agent. |
| datadog | PyPI | Use the Datadog client when the deployment is committed to Datadog APIs and agent conventions rather than Prometheus exposition. |
More infra guides
boto3 · opentelemetry-api · psutil · distro · @opentelemetry/api · google-cloud-storage · the whole shelf →
How this guide is made: grounded in the library's documentation, release notes, changelog, and issue history, on a fixed rubric — not a hands-on install of every release. The 50 most-downloaded entries are additionally install-verified in clean containers. Corrections: contact the desk.