datadog review
datadog 0.53.0 is the older hand-written Python client from Datadog. Its `statsd` object sends custom metrics, events, and service checks to a nearby Agent over UDP or a Unix socket. `threadstats` batches metrics in-process and posts them over HTTP when an Agent is unavailable. The package also contains a partial REST API client and the `dog` command. Version 0.53.0 adds `DD_DOGSTATSD_URL` handling for both UDP and Unix URLs and retries failed Unix-socket connections. Our install was pure Python, typed, and imported successfully.
Install datadog for custom DogStatsD metrics beside an existing Agent. For REST automation or tracing, use Datadog's dedicated generated API client or `ddtrace`, and test the missing-Agent path before trusting a dashboard.
We installed it
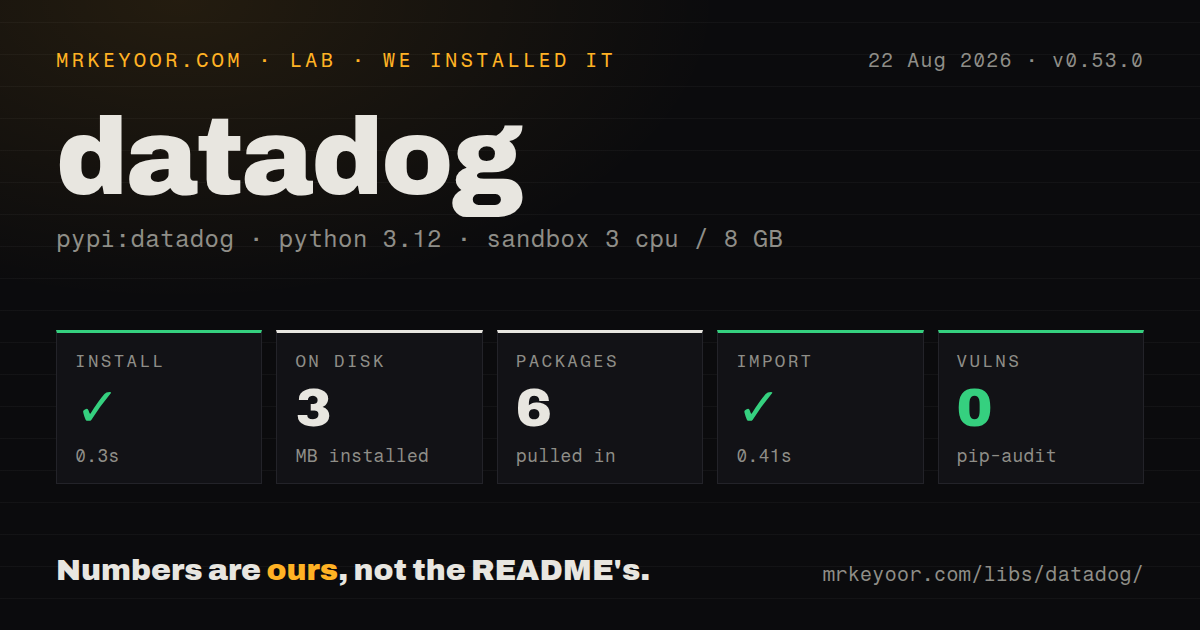
| Install | ✓ · 0.3s | 6 packages on disk · 3 MB |
| Import | ✓ | import datadog in 0.41s · pure Python · py.typed · requires Python !=3.0.*,!=3.1.*,!=3.2.*,!=3.3.*,!=3.4.*,!=3.5.*,!=3.6.*,>=2.7 |
| Known vulns | 0 | (pip-audit) |
Answers from our run
Does datadog install cleanly?
Yes. In a fresh container with an empty cache, pip install datadog finished in 0.3s, leaving 6 packages and 3 MB on disk. pip-audit reported no known vulnerabilities.
What does datadog need to run?
Python !=3.0.,!=3.1.,!=3.2.,!=3.3.,!=3.4.,!=3.5.,!=3.6.*,>=2.7, and nothing compiled: it is pure Python. In our run import datadog succeeded in 0.41s, and the package ships py.typed for type checkers.
datadog or datadog-api-client: which should you use?
datadog-api-client: Choose it for generated models and current v1 and v2 REST endpoint coverage. Install datadog for custom DogStatsD metrics beside an existing Agent.
When should you not use datadog?
Use datadog-api-client for current REST coverage. This package exposes a hand-maintained subset, and the README directs full API users to the generated client.
Use it if
- A Datadog Agent already runs beside the application and you need counters, gauges, histograms, distributions, timing metrics, events, or service checks.
- Request and coroutine latency should be recorded with the documented decorator or context-manager API.
- Kubernetes workloads can provide `DD_ENTITY_ID` so the Agent adds pod and container origin tags to emitted metrics.
- A maintenance script only needs one of the older hand-written REST resources or the bundled `dog` command.
- Use `datadog-api-client` for current REST coverage. This package exposes a hand-maintained subset, and the README directs full API users to the generated client.
- Use `ddtrace` for traces, profiling, and automatic framework instrumentation. Installing `datadog` does not create spans.
- Avoid UDP DogStatsD when delivery acknowledgement is mandatory. Sending to a missing Agent can succeed locally while the metric never reaches a dashboard.
- Do not accept the defaults for a high-volume metric loop. Buffering and client aggregation start disabled, so repeated calls can become repeated socket writes.
- Treat the Python requirement metadata cautiously. Version 0.53.0 still advertises Python 2.7 with only Python 3.0 through 3.6 excluded, which does not describe a useful modern support policy.
Setup reality
We installed datadog 0.53.0 in a fresh Python 3.12 Bookworm container with no cache. Installation succeeded in 0.3 seconds, leaving 6 packages and 3 MB on disk. pip-audit found 0 known vulnerabilities. The pure-Python package declares 3 direct dependencies, includes py.typed, and uses BSD-3-Clause. Its unusual Python requirement still permits 2.7 while excluding 3.0 through 3.6. import datadog worked in 0.41 seconds.
DogStatsD talks to an Agent, not directly to the Datadog service. Set DD_DOGSTATSD_URL to a UDP address or Unix socket, or pass the endpoint during initialization. Version 0.53.0 fixes that environment-variable path for both URL types and retries Unix-socket connect failures. On a development machine without an Agent, disable collection deliberately or expect UDP calls to return without proving delivery.
HTTP API calls need an API key and application key. Accounts outside the default US site also need the correct API host. A valid EU key sent to the default host looks like an authentication problem. The generated datadog-api-client is the safer choice when endpoint coverage matters.
initialize() changes the module-level statsd singleton and appends constant tags, so call it once before worker forks. Buffering and aggregation are disabled initially. Enable the appropriate mode for hot loops, then call statsd.stop() before short-lived processes exit if a background sender or queued data is in use. Timing values default to seconds unless use_ms changes the unit.
Patterns
Initialize the shared DogStatsD client once initialize-and-send
from datadog import initialize, statsd

# explicit
initialize(
    statsd_host="127.0.0.1",
    statsd_port=8125,
    statsd_namespace="checkout",
    statsd_constant_tags=["env:prod", "service:api"],
)

# or entirely from the environment:
#   DD_DOGSTATSD_URL=udp://localhost:8125
#   DD_AGENT_HOST=dd-agent  DD_DOGSTATSD_PORT=8125
#   DD_ENV=prod  DD_SERVICE=api  DD_VERSION=1.4.0
initialize()

statsd.increment("orders.created")   # -> checkout.orders.created
Imports before and after initialization refer to the same module object. A repeated call appends constant tags again, so configure it once during startup and before creating workers.
Choose a metric with matching aggregation metric-types
from datadog import statsd

statsd.increment("queue.jobs.enqueued")                 # count
statsd.decrement("queue.depth")
statsd.count("bytes.uploaded", 4096)

statsd.gauge("queue.depth", 42)                          # last value wins
statsd.set("users.active", user_id)                      # unique count

statsd.histogram("payload.bytes", 1024)                  # percentiles, Agent-side
statsd.distribution("request.latency", 0.180)            # percentiles, global

# backfill a past minute (counts and gauges only)
statsd.count_with_timestamp("orders.created", 3, timestamp=1_754_400_000)
Histograms calculate percentiles at the Agent, while distributions send values for server-side aggregation across hosts. A gauge keeps the last value per context, so distinguish writers with tags when they represent separate sources.
Record function and block duration time-code
from datadog import statsd

@statsd.timed("checkout.charge.latency", tags=["gateway:stripe"], use_ms=True)
def charge(order):
    ...

@statsd.timed(use_ms=True)          # name defaults to module.function
async def fetch_user(uid):
    ...

with statsd.timed("report.build", use_ms=True) as timer:
    build_report()
print(timer.elapsed)                 # milliseconds, because use_ms=True

# same shape, but emits a distribution instead of a timing
@statsd.distributed("checkout.charge.latency", use_ms=True)
def charge_v2(order):
    ...
DogStatsd starts with seconds as the timing unit. Set milliseconds consistently if monitors expect them; mixing both under one metric name changes the scale by a factor of 1,000. Exceptions still produce a duration sample.
Bound tag cardinality and sampling tags-and-sampling
from datadog import statsd

statsd.increment(
    "http.requests",
    tags=[f"route:{route}", f"status:{code}", f"method:{method}"],
)

# emit 10% of the points, values scaled back up by the Agent
statsd.increment("cache.lookup", sample_rate=0.1)

# global tags added to everything from this client
statsd.constant_tags.append("region:ap-south-1")
User IDs, request IDs, and raw URLs create unbounded tag combinations and custom-metric cost. Sampling is meaningful for count-like values the Agent can scale; a sampled gauge may simply omit its latest value.
Buffer and aggregate a burst batch-metrics
from datadog import statsd

# one packet for the whole block
with statsd:
    for row in rows:
        statsd.increment("rows.processed", tags=[f"table:{row.table}"])

# or turn on client-side aggregation for the process lifetime
statsd.enable_aggregation(flush_interval=2.0)

# and, for high throughput, hand sending to a background thread
statsd.enable_background_sender(sender_queue_size=10_000)
...
statsd.stop()      # flush and join before the process exits
Both features start off. The context manager flushes its buffer on exit, and aggregation combines matching metric contexts. A background sender needs `statsd.stop()` so queued values are flushed before a job terminates.
Send through the Agent's Unix socket unix-socket-transport
from datadog import initialize, statsd

initialize(statsd_socket_path="/var/run/datadog/dsd.socket")

# equivalent, and usually set by the deployment rather than the code:
#   DD_DOGSTATSD_URL=unix:///var/run/datadog/dsd.socket

# larger default packet on UDS (8192) than UDP (1432)
initialize(statsd_socket_path="/var/run/datadog/dsd.socket", max_buffer_len=8192)
Mount the Agent socket and grant the application user write access. Unlike an unconnected UDP destination, a Unix-socket connect can fail visibly; version 0.53.0 retries that connection path.
Emit deployment events and health checks events-and-service-checks
from datadog import statsd

statsd.event(
    title="Deploy finished",
    message="api %s rolled out to prod" % version,
    alert_type="success",          # error | warning | info | success
    aggregation_key="deploy:api",
    tags=["env:prod", "service:api"],
)

statsd.service_check(
    check_name="api.db.can_connect",
    status=0,                       # 0 OK, 1 WARNING, 2 CRITICAL, 3 UNKNOWN
    message="primary reachable",
    tags=["db:primary"],
)
Events and service checks use the DogStatsD transport and its packet limits. Set an aggregation key for repeated events so one noisy deploy task does not create a separate timeline entry for every update.
Call a legacy REST resource rest-api-calls
from datadog import initialize, api

initialize(
    api_key=os.environ["DD_API_KEY"],
    app_key=os.environ["DD_APP_KEY"],
    api_host="https://api.datadoghq.eu",   # US1 is the default
)

api.Event.create(
    title="Nightly import complete",
    text="imported %d rows" % n,
    tags=["job:import"],
)

api.Monitor.mute(monitor_id, end=int(time.time()) + 3600)
api.Metric.send(metric="batch.rows", points=n, tags=["job:import"])
REST calls require an API key, application key, and the host for your Datadog site. This hand-written surface is incomplete; confirm the method exists or switch to `datadog-api-client`.
Inspect a missing-metric path debug-missing-metrics
import logging
from datadog import statsd

# the library attaches a NullHandler, so turn its logger on first
logging.basicConfig(level=logging.DEBUG)
logging.getLogger("datadog.dogstatsd").setLevel(logging.DEBUG)

statsd.increment("probe")
print(statsd.packets_dropped, statsd.bytes_dropped)

# confirm the Agent is actually listening
#   echo -n 'probe:1|c' | nc -u -w1 127.0.0.1 8125
#   sudo datadog-agent status | grep -A5 dogstatsd

# in development, stop pretending to send at all
#   DD_DOGSTATSD_DISABLE=1
UDP can accept a local write with no Agent listening, and the package logger starts with a NullHandler. Client telemetry includes dropped packet and byte counters and is enabled by default without custom-metric billing.
Give a library its own DogStatsd instance own-client-instance
from datadog.dogstatsd import DogStatsd

metrics = DogStatsd(
    host="dd-agent",
    port=8125,
    namespace="worker",
    constant_tags=["queue:emails"],
    disable_buffering=False,
    use_ms=True,
)

metrics.increment("jobs.done")

# in tests
null = DogStatsd(disable_telemetry=True, track_instance=False)
Reusable libraries should not reconfigure the host application's singleton. A separate instance can use its own batching policy; set `track_instance=False` for a disposable client that should not join global fork tracking.
Handle forks and orderly shutdown fork-and-shutdown
from datadog import initialize, statsd

# gunicorn.conf.py
def post_fork(server, worker):
    initialize()                     # per-worker configuration
    statsd.enable_background_sender()

def worker_exit(server, worker):
    statsd.stop()                    # flush, join, close the socket

# a plain script
import atexit
atexit.register(statsd.stop)
Where `os.register_at_fork` exists, tracked clients reset their threads and sockets around a fork. Disable that support only when custom handlers conflict. `stop()` drains buffered work and joins the sender during shutdown.
Post metrics when no Agent can run agentless-metrics
from datadog import initialize, ThreadStats

initialize(api_key=os.environ["DD_API_KEY"])

stats = ThreadStats()
stats.start(flush_interval=10)          # background thread posts over HTTPS
stats.increment("batch.rows", 100, tags=["job:import"])
stats.flush()

# AWS Lambda
from datadog import datadog_lambda_wrapper, lambda_metric

@datadog_lambda_wrapper
def handler(event, context):
    lambda_metric("lambda.invocations", 1, tags=["fn:importer"])
ThreadStats needs an API key and adds HTTP latency and failure handling to the process. Datadog documents a separate `datadog-lambda` package and extension for Lambda workloads; use this path only when its tradeoffs fit.
Alternatives
| Package | Registry | Pick it when |
|---|---|---|
| datadog-api-client | PyPI | Choose it for generated models and current v1 and v2 REST endpoint coverage. |
| ddtrace | PyPI | Choose it for distributed tracing, profiling, and automatic framework instrumentation. |
| opentelemetry-sdk | PyPI | Choose it when instrumentation must remain vendor-neutral and export through an OpenTelemetry pipeline. |
| statsd | PyPI | Choose it for a plain StatsD server that does not need Datadog tags, events, or service checks. |
More infra guides
boto3 · opentelemetry-api · psutil · distro · @opentelemetry/api · google-cloud-storage · the whole shelf →
How this guide is made: grounded in the library's documentation, release notes, changelog, and issue history, on a fixed rubric — not a hands-on install of every release. The 50 most-downloaded entries are additionally install-verified in clean containers. Corrections: contact the desk.