Thirty-two tool adapters trade one dashboard for uneven accuracy
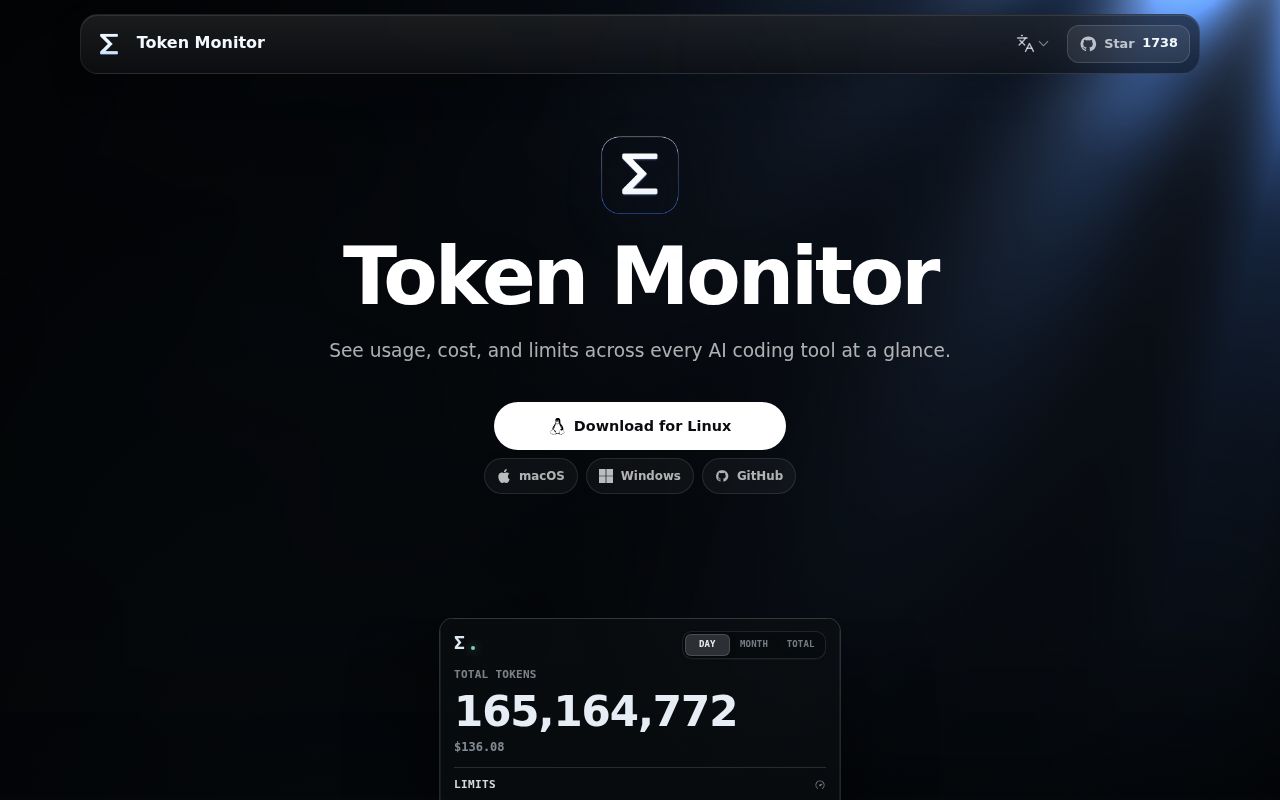
Token Monitor reads usage records left by more than 32 AI coding tools and puts token totals, estimated cost, account limits, models, sessions, and projects into one Electron widget. Claude Code, Codex, and OpenCode get per-session detail. Other integrations expose only token use or provider limits. That distinction matters because the interface can look unified while each adapter depends on a different file layout, database, cookie, or API. The README is candid about which columns each tool supports.
The local-first design is the strongest reason to try it. Prompts, replies, source code, and file contents stay on the machine, according to the privacy section. Session detail is read when requested and is never synced. A user can still enable networked features, including update checks, provider-limit queries, Discord Rich Presence, or multi-device sync. The product therefore reduces central collection of sensitive text. It still needs access to private local records and, for some limit providers, account credentials.
A 370-day history depends on what each source keeps
Token Monitor can preserve observed daily totals so its heatmap survives after a source tool deletes old sessions. The sync payload and heatmap use a rolling 370-day window, while the README says Claude Code keeps transcripts for 30 days by default. Older observations remain local for future views. This archive is opt-in, which is sensible because extending history also extends the life of usage records on disk.
Accuracy is bounded by discovery. Open issue 375 documents one Windows setup where Token Monitor showed 10.4 million Claude tokens against 21.54 million in a provider export. The reporter traced much of the 51.7% shortfall to Claude Desktop agent-mode transcripts outside the roots being scanned. That billing comparison came from the issue reporter. It gives competent users a concrete reason to compare the dashboard against provider data before trusting budgets or chargeback decisions.
What happened when we ran it
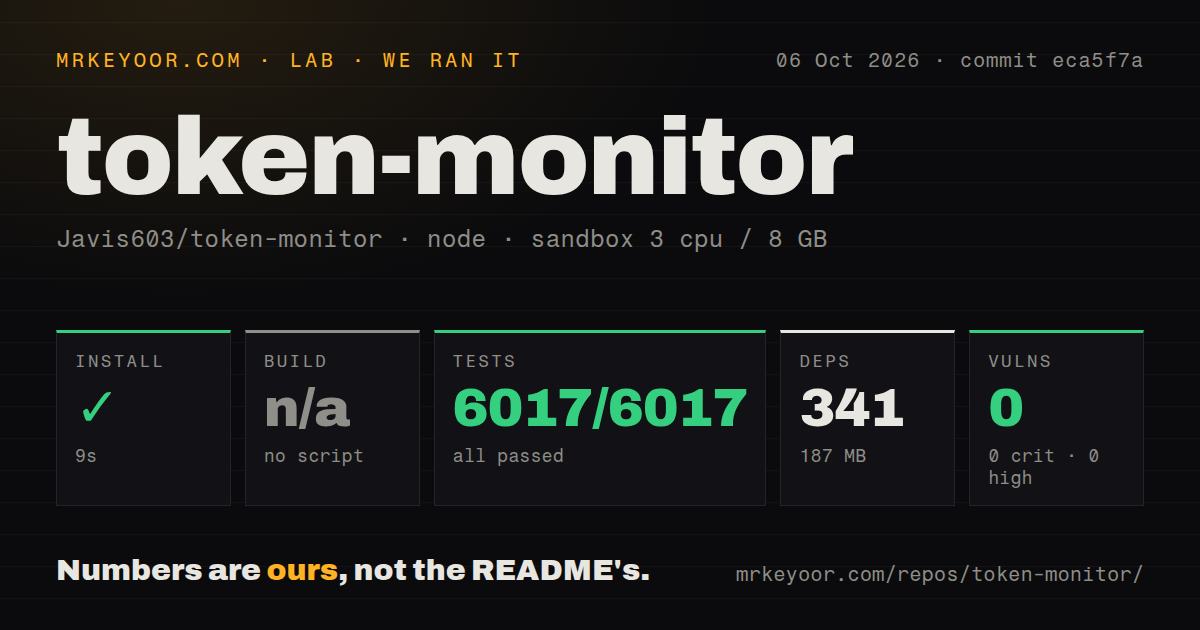
Our sandbox installed 340 npm packages in 20 seconds, leaving 172 MB on disk. The checked-out commit, 3e80f82, had no build script or target, so we skipped a build rather than substituting another command. The repository contained 759 files and about 184,821 source lines. It also had 6 CI workflow files and a tests directory, though no Dockerfile. Those measurements describe a fresh unprivileged Node 22 container with 3 CPUs and 8 GB of RAM.
The node:test suite completed in 103 seconds with 3,674 passed and 0 failed out of 3,674. That is unusually strong coverage evidence for a desktop utility with dozens of parsers. Npm audit still reported 1 known vulnerability, rated high, with 0 critical, 0 moderate, and 0 low findings. The supplied lab result does not name the affected package or prove exploitability, so the correct next step is to inspect the audit path before packaging or allowing credentials into the app.
Live mode can miss every update under constant writes
Issue 520 describes a failure mode that matters most to the audience running many agents at once. In live collection mode, every file event resets a 1,500 ms debounce timer. The report says a tree with roughly 7,800 JSONL files, about 2,200 directories, and 10 or more active sessions kept producing events quickly enough that collection stopped for more than 24 hours. Switching that installation to interval mode restored scans. A pull request addressing the ceiling was active when we checked.
Two other open reports narrow the desktop risk. Issue 487 says Token Monitor v0.45.0 through v0.47.0 crashed or showed a blank window on one Windows 11 machine with an AMD Radeon 780M. Issue 502 reports recurring 80 to 110% CPU use from an Electron renderer on one Apple Silicon hub client. Neither report proves a fleet-wide defect. Both are specific enough that teams deploying the widget broadly should pilot it on their actual hardware and watch CPU, startup, and refresh behavior.
Multi-device sync needs one trusted hub and one shared secret
Single-machine use starts locally without a hub or configuration. For several devices, the README gives 3 choices: host inside an always-running widget, run the Node hub, or deploy the Cloudflare Worker. Every client receives a hub URL and shared secret. The in-widget route stops when that app quits, while the Node and Worker paths move availability into infrastructure you must operate. Server-Sent Events distribute aggregate updates between connected widgets within seconds.
The setup details are better than the cheerful quick start suggests. Windows Subsystem for Linux data is merged about every 5 minutes, but SQLite-backed tools may need a headless agent inside WSL. Qoder CN needs either a sqlite3 command or a sufficiently new Node runtime, and the README warns that a database schema change can break the adapter. Building installers from source requires Node.js 22.15 or newer and the target operating system because Electron Builder cannot make every package cross-platform.
Version 0.48.0 is active enough to demand frequent checks
GitHub showed 1,738 stars, 76 open issues and pull requests, and a last push on August 26, 2026. Release v0.48.0 shipped the same day with Kimi Work tracking, Trae CN credits, Sub2API account support, collector fixes, and usage-accounting changes. This is active maintenance. Fast adapter growth also means provider formats and regression risk keep moving. The combined open count includes pull requests and should not be read as 76 confirmed bugs.
Token Monitor gives a solo developer a useful answer to a messy question: which coding tool consumed what, on which machine, and how close is each account to its limit? Our 3,674 passing tests make the parser layer worth taking seriously. The high-severity audit finding and concrete collection reports do not disqualify it; they set the operating rule. Compare totals with provider records, prefer interval collection under heavy write volume, and pilot the Electron app before making its display the basis for spending decisions.