Tempo 3.0 is a trace backend, while Grafana is the interface
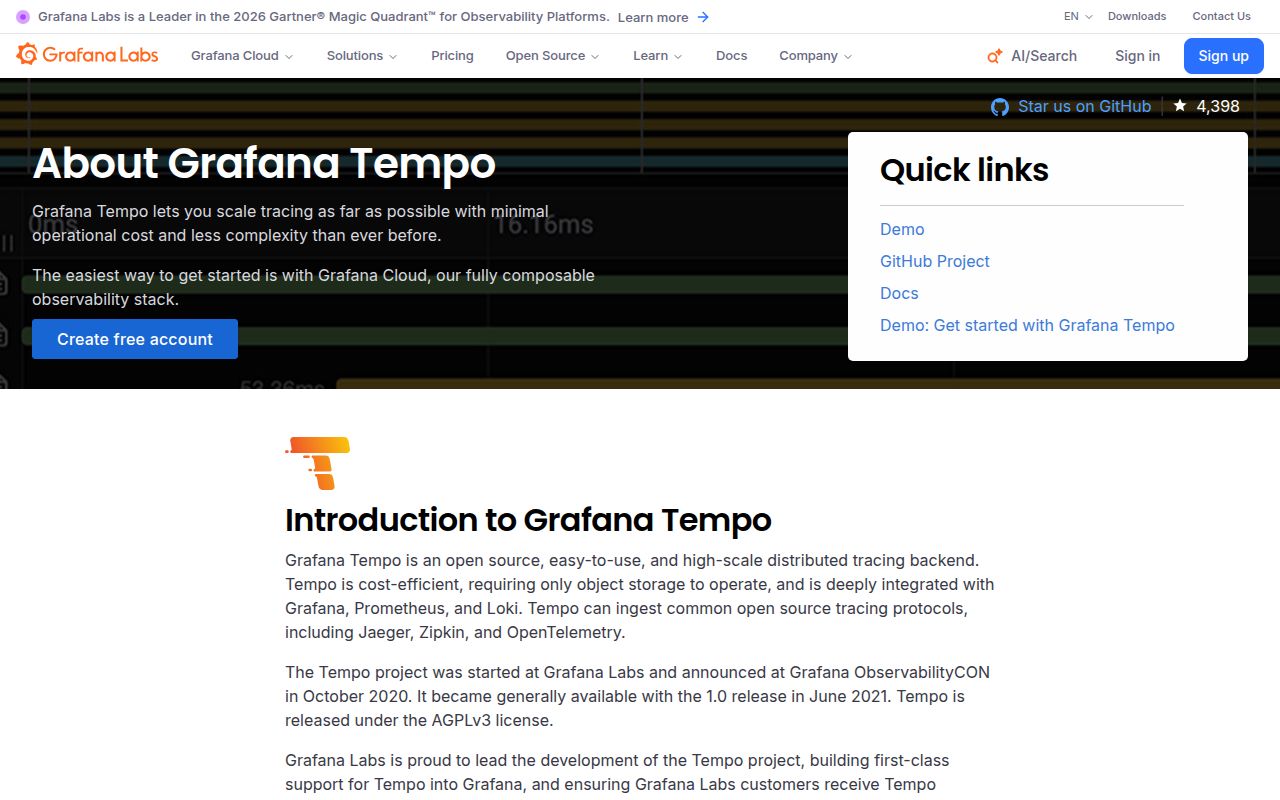
Tempo 3.0 receives spans, arranges their resources and attributes in Apache Parquet, and writes blocks to object storage. It can ingest OpenTelemetry, Jaeger, and Zipkin formats. Engineers can retrieve a known trace by ID or search across traces with TraceQL. The division of labor matters: Tempo stores and queries the data, while an instrumented application and a collector must produce useful spans in the first place.
Grafana is where most people will inspect the result. Traces Drilldown gives them point-and-click views of rates, errors, duration, and attribute comparisons, while TraceQL handles precise structural searches. The README still describes TraceQL metrics as experimental. Teams buying Tempo for a polished all-in-one tracing product will therefore be assembling several parts: instrumentation, a collector, Tempo, Grafana, and often a metrics or logs backend for correlation.
One Tempo 3.0 binary becomes a Kafka system for high availability
All Tempo 3.0 components compile into the same binary, and the target flag decides which ones run in a process. Monolithic mode starts the required components together and sends spans directly from the distributor to the live store. It does not require Kafka. This is the sensible evaluation path, and the project also allows local filesystem storage for development, although its production guidance recommends object storage.
Microservices mode changes the job. Distributors write to a Kafka-compatible queue, live stores serve recent traces, block builders create long-term blocks, and query services read recent and stored data. Backend workers handle compaction and retention. The split gives operators separate scaling and failure boundaries, but it also gives them Kafka partitions, more processes, caches, local working space, and object-storage behavior to monitor. Tempo 3.0 high availability is a distributed platform, not an object-storage-only service.
What happened when we ran it
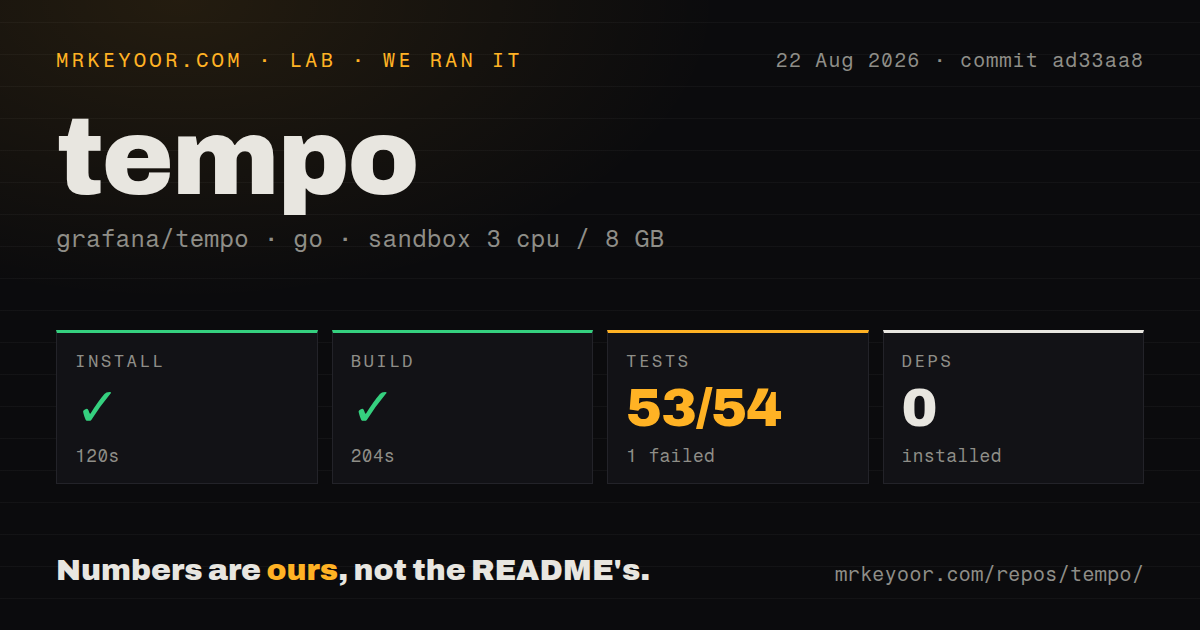
Our commit ad33aa8 checkout installed in 120 seconds with 0 packages added, then built successfully in 204 seconds. The test command ran for 633 seconds and failed: 53 packages passed and 1 failed out of 54. We used an unprivileged golang:1.24-bookworm container with 3 CPUs, 8 GB of RAM, and no secrets.
The final log lines show successful packages under tempodb, including vParquet3, vParquet4, vParquet5, the pool, and the write-ahead log, followed by a bare FAIL. That tail does not name the failing package or give an error message, so it supports one conclusion only: the suite was not clean. The 25.7 MB checkout had 1,934 files and about 323,104 source lines, which makes a targeted rerun preferable to guessing.
Repository signals were mixed but useful. We counted 16 CI workflow files, which shows that upstream automation is substantial. We found no top-level Dockerfile and no tests directory, even though tests are spread across Go packages and the README links to Docker Compose, Helm, and Jsonnet examples. A newcomer should follow those deployment examples rather than assume the repository root is a ready container build context.
Three storage APIs still leave authentication to the operator
Tempo supports Amazon S3 and compatible services, Google Cloud Storage, and Azure Blob Storage for long-term data. Local disk is documented for development. A real installation also needs retention choices, bucket permissions, and enough query capacity for the searches users will run. The optional metrics generator can derive rate, error, and duration metrics and service graphs, then send them to a metrics backend such as Prometheus or Grafana Mimir.
Tempo has no included authentication layer. The official operations guide tells operators to place an authenticating reverse proxy in front of its services. Multi-tenant setups rely on that trusted boundary to set X-Scope-OrgID; accepting the header from an untrusted client would undermine tenant separation. This omission is manageable for an established platform team, but it rules out treating port 3200 as a public endpoint after a quick Docker Compose trial.
Tempo 3.0 makes the 2.x migration a real operations project
Tempo 3.0 replaces the older ingester path with Kafka, block builders, live stores, and backend scheduling in microservices mode. A monolithic deployment can update its configuration and binary. A distributed 2.x deployment has to run 2.x and 3.0 in parallel, share object storage, move traffic, verify reads and writes, and then retire the old system. The migration guide also requires vParquet4 or newer blocks.
Once the 2.x deployment is decommissioned, the guide says there is no in-place downgrade. That makes staging and a preserved old deployment important until the new path has been checked. The project provides Tempo Vulture for end-to-end write and read validation, plus a configuration migration command, but those tools do not remove the infrastructure overlap or the need to inspect the generated configuration before cutover.
August 2026 activity supports adoption, with one failed package test to resolve
Grafana published v3.0.3 on August 13, 2026, and pushed repository code again on August 26. GitHub reported 5,455 stars and 166 open issues and pull requests when we checked. The latest release includes dependency security updates, refreshed MCP documentation, a version-reporting fix, and removal of guidance for multiple monolithic instances. Those are signs of active maintenance around the current architecture.
Tempo is easiest to justify when Grafana is already the front end and a platform team owns OpenTelemetry collection, storage, and access control. Jaeger is the closer comparison for teams that prefer its tracing workflow, Zipkin suits a narrower service, and SigNoz packages more of the observability experience together. Our 204-second build passed, but the 53-to-1 package test result blocks a clean bill of health for commit ad33aa8.