
One dashboard understands DGX Spark and local LLM servers
sparkDash watches the things a generic host dashboard tends to miss on an NVIDIA DGX Spark. It shows the shared-memory split, GPU processes, thermal throttling, LLM request rates, model-server queues, and several inference backends. A single view can cover local and remote Sparks, plus ordinary Linux workstations with NVIDIA cards. Remote collection happens over SSH, so there is no sparkDash agent to install on every monitored box.
The checked repository is compact for that scope: 224 files, about 45,468 lines of source, and a 10 MB checkout. React 19 and Vite provide the browser interface, while an Express 5 server runs the collectors, REST endpoints, and WebSocket stream. Version 1.8.9 recognizes llama.cpp, vLLM, SGLang, ds4-server, EXL3, TensorFold, and q27 endpoints. It also has opt-in ComfyUI and Hermes Agent checks.
The specialization is the selling point. Decode and prefill benchmarks can target local or remote OpenAI-compatible servers, and the app understands metrics such as token rates, time to first token, queue state, and KV cache use when a backend publishes them. Results remain dependent on what each server exposes. The README explicitly says TensorFold may show 0 tokens per second when its health response lacks cumulative token totals.
The small Node install hides a powerful host container
Our npm install added 226 packages in 6 seconds and occupied 181 MB. Those are modest numbers beside many dashboard projects. The production Compose file is less modest: it targets linux/arm64, uses host networking, joins the host PID namespace, runs privileged, and mounts host /proc, /sys, and / paths read-only. It also mounts nvidia-smi and driver libraries as a fallback.
Those permissions have a purpose. Local GPU processes and host metrics are otherwise difficult to see from a container, and a loopback-bound LLM server is unreachable through ordinary bridge networking. Still, the dashboard becomes a sensitive operations component. It can inspect machines over SSH, store encrypted SSH passwords, run Hermes updates, cancel ComfyUI work, and invoke a configured shutdown helper. Treat its configuration directory and secret key like administrative credentials.
What happened when we ran it
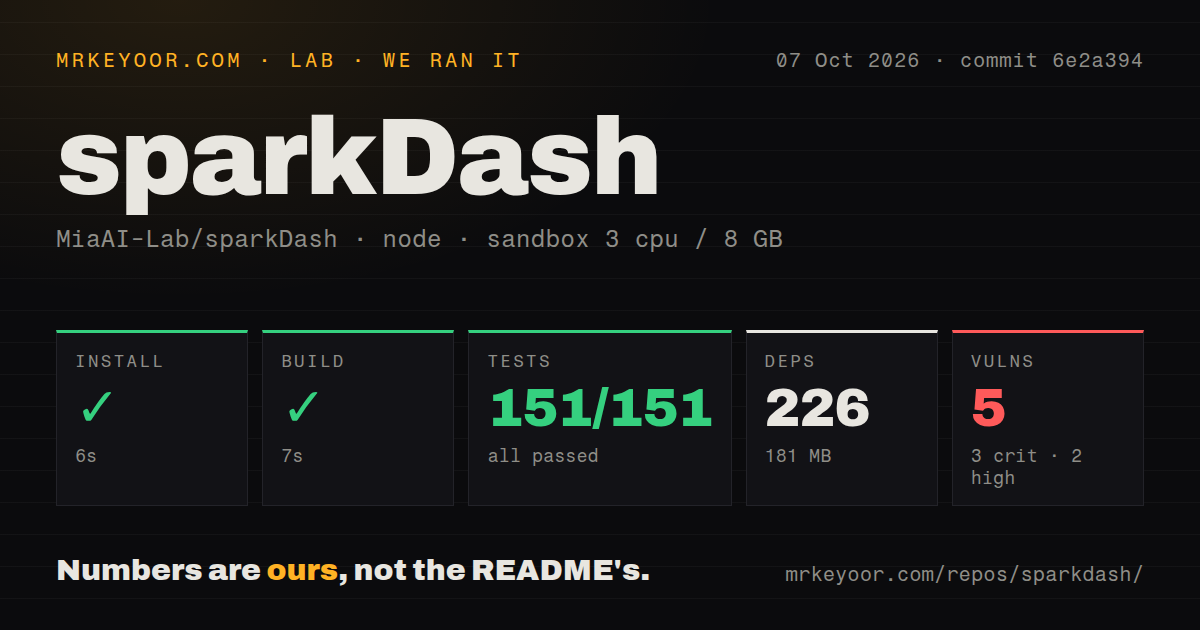
Our unprivileged Debian sandbox installed commit 6e2a394 in 6 seconds on 3 CPUs with 8 GB of RAM and no secrets. The production frontend built successfully in 7 seconds. Tests finished in 27 seconds, and Vitest reported 151 passed with 0 failed. That is a clean repository-level result for the path we ran. We did not attach a DGX Spark, exercise SSH collection, or measure monitoring accuracy.
The dependency audit was the clear exception. Npm audit found 5 known vulnerabilities: 3 critical and 2 high, with none rated moderate or low. The measurement block does not identify the affected packages or whether a vulnerable path is reachable, so we cannot name a safe workaround from this run. An operator should reproduce the audit, trace each advisory into the runtime or build tree, and document the upgrade decision before exposing the service.
The repository included a Dockerfile and Compose file, but our scan found 0 CI workflow files and no tests directory. The 151 passing tests still count. They run through Node's built-in test runner and Vitest from package scripts, including co-located test paths under server code rather than a root test folder. The missing CI configuration means GitHub does not show us an in-repo workflow that enforces those checks on every proposed change.
Remote access is safe only when you choose the safe mode
The default listener binds to 127.0.0.1:5555, which is sensible. For another computer, the README recommends an SSH tunnel, authenticated reverse proxy, or Tailscale Serve. A direct non-loopback bind can use SPARKDASH_TOKEN. Without that token, remote access is open by default unless SPARKDASH_ALLOW_OPEN_REMOTE=0 forces startup to fail. Reachable users can read telemetry, edit settings, and trigger power actions.
Version 1.8.9 documents the warning plainly, and our lab found 5 high-or-critical audit findings that add another reason to avoid casual exposure. The browser stores its bearer token locally and sends it for protected requests and live telemetry. That is adequate for a trusted small network when transport and access are controlled. It is not a substitute for the identity, audit logs, or role separation expected from a large shared operations platform.
Active fixes do not replace a release process
GitHub showed 548 stars and 22 combined issues and pull requests on October 7, 2026. The repository was pushed on October 6, and the recently updated queue contained feature and fix pull requests. There was no latest GitHub release returned by the API, even though the package and README identify version 1.8.9. Users therefore need to pin a commit or image source instead of relying on a tagged release artifact.
Issue 73 documents excessive SSH session churn in an older remote polling path; it is closed, and the current README describes connection reuse. Issue 124 remains open and asks about running the server from a non-ARM mini PC. Combined with the ARM64 Compose target and 0 CI workflows, that makes the supported shape clear: sparkDash is strongest on the hardware it was built around. On a trusted DGX lab, its specific LLM and fleet controls earn the setup. Elsewhere, DCGM Exporter or Netdata will usually fit the operating model better.