Recharts 3.10.1 turns chart parts into React components
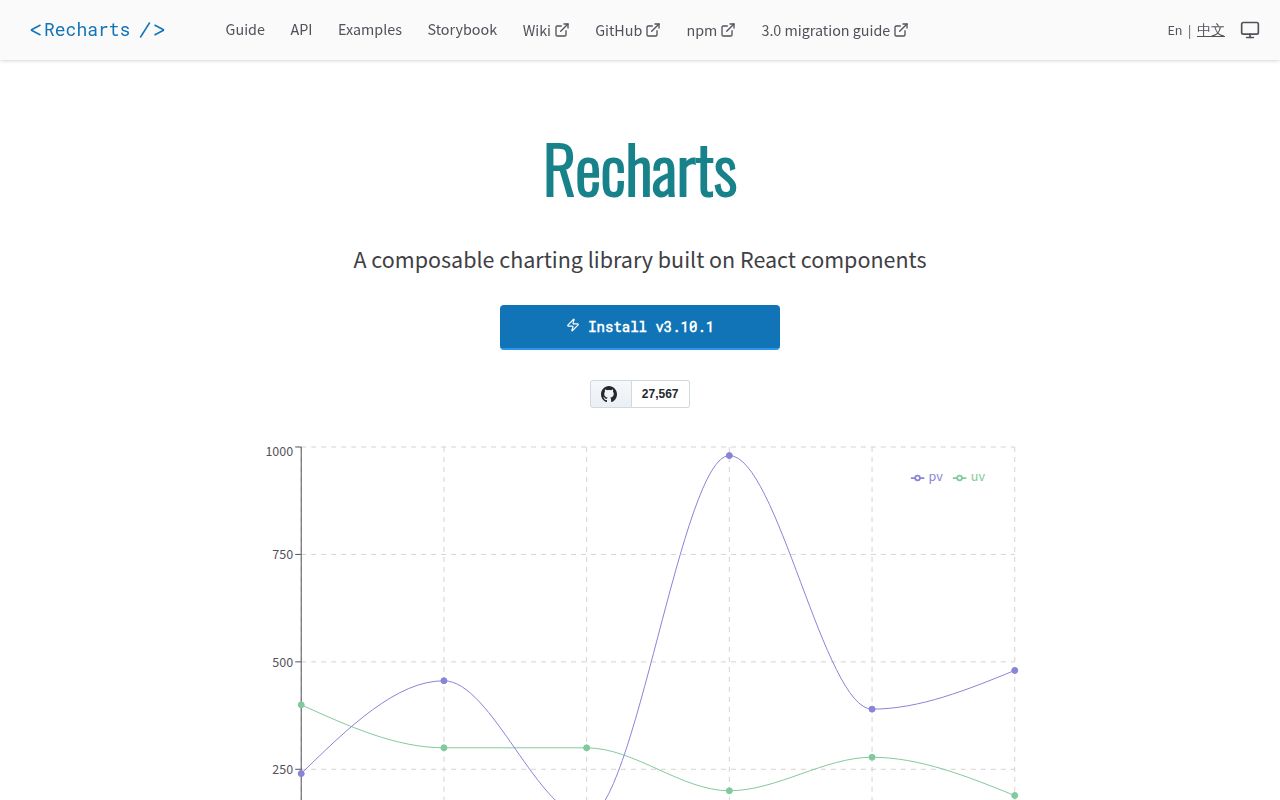
Recharts 3.10.1 expresses a chart as a tree of components rather than a separate configuration object. The README's first example nests an axis, tooltip, grid, and two lines inside LineChart. If you already reason about a screen as React components, that shape is easy to read and review. D3 handles much of the chart math underneath, while the application stays in JSX and passes its own data through props.
The separation is useful when a product chart needs more than a preset. Axes, labels, legends, reference marks, tooltips, and series can be changed independently. The output is SVG, so ordinary CSS and browser inspection remain useful. This is why Recharts fits product dashboards so well: a chart can live beside the rest of a React interface without forcing the team to adopt another rendering model for every visual change.
What happened when we ran it
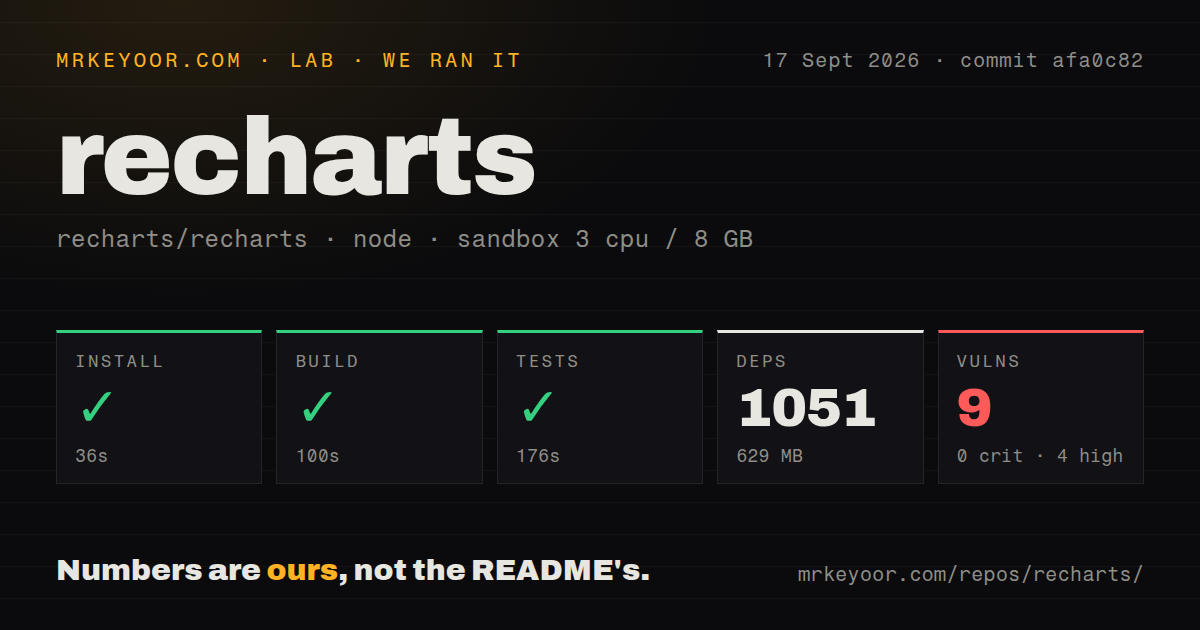
Our sandbox installed the Recharts checkout at commit afa0c82 in 36 seconds. npm added 1,051 packages and left 629 MB on disk. The build then succeeded in 100 seconds, and the test command succeeded in 176 seconds. Nothing in those three steps failed, which is good evidence that a contributor can reproduce the main repository checks in a fresh Node 22 container with 3 CPUs and 8 GB of RAM.
The audit was less tidy: npm reported 9 known vulnerabilities, split into 4 high, 4 moderate, and 1 low, with 0 critical. The checkout itself contained 3,760 files, about 226,109 lines of source, and occupied 86.7 MB before installation. It is a workspace monorepo with a tests directory, 6 CI workflow files, and a Compose file. There is no repository Dockerfile, so the source tree is a substantial contributor environment rather than a packaged application stack.
SVG becomes costly when every data point must stay visible
Open issue #1356 describes a line chart becoming laggy with 8,000 dots and asks for built-in downsampling. That report began against an old beta, so it is not a benchmark of the current release. Its continued open state still matters because the documented API does not promise automatic sampling. If your chart receives raw telemetry or long time series, reduce the points before rendering and test with the largest payload users will actually open.
A newer report, issue #7478, supplies a dense Sankey reproduction with 85 nodes and 112 links. The reporter says layout can hold the browser's main thread for minutes because branching paths multiply the work. A proposed fix exists, but the issue remains open. That makes Recharts a risky default for dense relationship diagrams, even when the raw node count sounds modest. Canvas or a library designed around large graphs is the safer comparison.
Version 3 still has a static server-rendering gap
Open issue #5997 reports that Recharts 3.0 returned only a wrapper div from React's renderToStaticMarkup, where version 2 produced the chart SVG. The reproduction uses a fixed-size line chart, so the problem is more specific than a missing responsive parent. The issue remains open. Teams generating email images, PDFs, social cards, or crawlable no-JavaScript charts should prove their exact server path before choosing version 3.
For a browser dashboard, that limitation may never surface. Recharts declares peer support from React 16.8 through React 19, and its client-side component model is the main attraction. The README also warns that react-is must match the installed React version. That small detail belongs in a shared dependency policy because a chart package is a poor place to discover that two React-related versions drifted apart.
Examples are clearer than some advanced API pages
The README gets a basic line chart onto the page in one compact example, and the public Storybook gives visual examples for individual components. The development guide is even more concrete. It covers unit tests, Storybook, mutation tests, and Playwright visual checks across 9 browser and theme projects. A contributor can see which command creates each published output and which generated directories should stay out of source control.
The API reference is less consistent once you move past familiar chart parts. Open issue #4438 uses Brush and Polygon as examples of components whose prop tables do not explain what the component is for. That is a fair description of the learning curve. Recharts has plenty of reference material, but unusual combinations may send you from the API page to Storybook, source, and issue search before the intended behavior becomes clear.
September activity outweighs the July release date
GitHub recorded 27,567 stars and a last push on September 17, 2026. Its combined open count was 445 issues and pull requests, while GitHub search returned 402 open issues. That is a large queue, yet current activity is easy to see: several visual regression pull requests were merged on September 17, and issue #5988 received an update the same day. Recharts is busy, not dormant.
The latest stable release was version 3.10.1 on July 25, 2026. It fixed Pie label radii, a duplicated-category tooltip fallback, and bar-gap behavior when a maximum width clamps a bar. Those are ordinary maintenance fixes in mature chart code, where edge cases often sit at the intersection of layout and interaction. The active main branch is already on a canary line, so production users should distinguish stable releases from newer repository work.
Choose Recharts for product charts, not every visualization problem
Recharts is the sensible first trial for a React team drawing ordinary line, bar, area, or pie charts. The component model is approachable, the 176-second test run passed, and active visual regression work suggests maintainers take rendered output seriously. Keep data volume bounded, run an accessibility pass on the finished chart, and budget time for advanced API questions that the prop reference does not answer.
Pick Chart.js when canvas or framework independence matters, and visx when a bespoke design needs lower-level parts. For complete server-side SVG or 8,000 visible dots, Recharts should not be the automatic choice.