This checkout supplies the interface, with a separate server behind it
Algorithm Visualizer offers a useful teaching idea: connect the code a learner reads to a picture of what the algorithm does. The repository under review is the React web application. Its README assigns APIs, including code compilation and execution, to a separate server repository. If you're choosing a classroom tool, deciding whether to use a hosted page or operate that system yourself comes before changing the interface.
The project also separates its algorithm examples from its tracing libraries. The tracers extract visualization commands from the example code. The web application interprets those commands into visualizations. That division matters when contributing: adding an algorithm and changing how a graph is drawn can send you to different repositories. Cloning this one doesn't give you ownership of the whole service.
What happened when we ran it
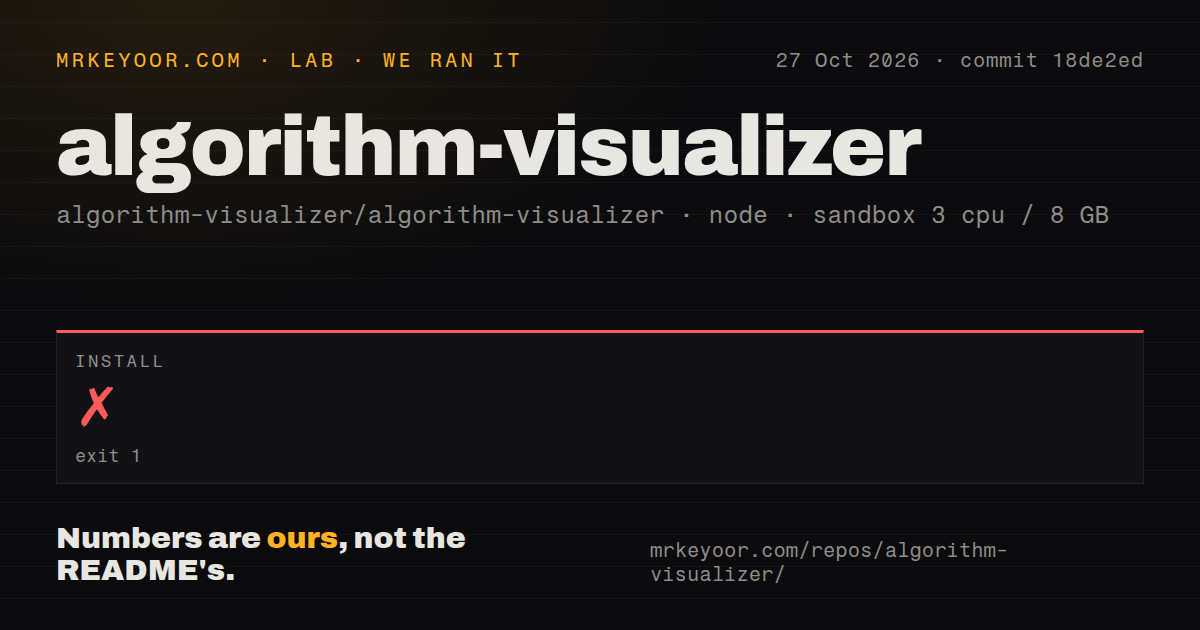
Our Algorithm Visualizer install failed with exit 1 after 202 seconds at commit 18de2ed on October 27, 2026. The sandbox was configured with 3 CPUs and 8 GB RAM, using image label lab-node:22. Unlike a label alone, the supplied log identifies the runtime: Node.js v22.23.2. It also reports Linux 7.0.0-38-generic and node-gyp v3.8.0.
The failure occurred while node-gyp was rebuilding node-sass. Its working-directory line points to /work/repo/node_modules/node-sass, and the tail ends with a build error. Those lines locate the failed step. They don't expose the first explanatory error, so they cannot establish whether a missing system tool, a runtime incompatibility or another condition caused it. Calling this a proven Node-version problem would go beyond the supplied log.
No build or test result was recorded. We therefore have no evidence here that the application launched, rendered an algorithm or successfully called its server. The failure also says nothing about whether the separately hosted website works for learners. Our result is a failed local dependency installation in the recorded environment, with a native Sass rebuild as the visible stopping point.
The checkout contained 104 files, about 3,197 source lines and 1.7 MB. The scan found no CI workflow files, Dockerfile or tests directory. Those are bounded repository observations. They don't prove that no validation exists elsewhere, and they don't make the failed installation a measurement of algorithm correctness.
Local development can still depend on the hosted service
The contribution guide asks you to choose between a local server and the remote server. For the remote option, it documents temporarily changing the application's proxy from localhost to the hosted Algorithm Visualizer address. That is a concrete service dependency, even though you're editing the React application on your own machine. Don't describe that route as an offline deployment.
For a fully local setup, the guide points to the separate server's instructions. The README says that server handles features such as GitHub sign-in and compiling or running code. We did not assess its credentials, execution isolation or operational requirements. Someone planning a shared classroom deployment needs to resolve those questions separately from getting this frontend's dependencies installed.
The application repository has an MIT license, according to GitHub's metadata. That license is a reason you can consider adapting its interface, but it doesn't establish the terms, compatibility or safety of every other component you connect. List the application, example collection and required tracers before estimating a fork. Otherwise a small-looking frontend checkout can hide a larger integration job.
Recent proposals don't establish a repaired default branch
GitHub recorded the last push as June 9, 2024. The issue feed nevertheless contains later activity, including an open contribution dated October 2026. An October 2026 pull request proposes a dependency-security check. That combination supports caution about current maintenance, rather than a claim that nobody is interested or that proposed changes have shipped.
The feed also contains a closed proposal to replace legacy node-sass with Dart Sass. Its description is useful context for someone investigating this area, but closed status alone does not prove that its changes merged. It is not evidence that our measured checkout had a repaired Sass path. Our run still stopped inside node-sass, and we haven't reproduced a replacement configuration.
For a scheduled class, I would avoid making local setup a student prerequisite until an instructor can reproduce the exact application and server combination. The project publishes a demo link in its README. Check the particular visualization and classroom network you intend to use before relying on that hosted route, because our failed local install provides no availability result for it.
VisuAlgo suits hosted lessons, JavaScript Algorithms suits reading code
VisuAlgo is a hosted site for visualizing data structures and algorithms through animation. Its English homepage includes sorting and graph modules and describes using your own input. Choose it when the immediate need is a lesson in a browser. Its terms say others may not fork the project or create variants, so it isn't a substitute for an MIT-licensed frontend you intend to adapt and redistribute.
JavaScript Algorithms and Data Structures supplies JavaScript examples with separate explanations for algorithms and data structures. Choose it when the learner's main question is how the implementation works. It offers a code-reading route rather than the visualization interface described by Algorithm Visualizer. Neither alternative was included in our sandbox run, so this is a comparison of documented teaching formats.
The docs explain the components better than the operating baseline
Our documentation scale runs from 1 for missing basic instructions to 5 for instructions verified across the documented workflows. This project earns 3: its component map and local-versus-remote instructions are useful, but they didn't give us a verified operating baseline after installation failed. Setup ease, support quality and deployment maturity remain unassessed.
If you want to contribute to this interface, keep the failed install log and reproduce the selected revision before editing its dependencies. If you want to teach an algorithm, first check whether a hosted visualization answers the lesson's question. A classroom deadline is a poor reason to take on an unverified frontend and execution server together.