One service handles traces, metrics, and logs
OpenTelemetry Collector sits between applications and observability backends. Receivers accept telemetry, processors modify or filter it, exporters send it onward, and service pipelines connect those parts for traces, metrics, and logs. The same design can run beside a workload as an agent or centrally as a gateway. This reduces vendor-specific code inside applications and makes it possible to change destinations without reinstrumenting every service.
The Collector is plumbing, not a database or user interface. It does not replace the backend that stores telemetry, answers queries, draws dashboards, or sends alerts. Its value is control in transit: batching, sampling, attribute changes, routing, redaction, retries, and protocol translation can live outside application processes. That central power also creates a failure domain. A bad filter or saturated exporter can affect many services at once.
OTLP v1.10.0 is stable while components have separate levels
The README says this codebase is built against OTLP protocol v1.10.0, which is considered stable. Individual Collector components still carry their own stability levels, and library compatibility tracks Go's supported minor versions. The first Collector release after a new Go minor adds that version and drops support for Go N-2. Custom-distribution builders therefore need to pin modules and read component-specific notes, even when the wire protocol is stable.
OpenTelemetry publishes core and broader distribution images, and the README documents Cosign verification using the release workflow identity. That is a good supply-chain control. Verification should happen in deployment automation, not as a one-time laptop command. Store the image digest alongside configuration so a rollback restores both code and behavior. A tag, a configuration file, and a set of enabled components together define the running collector.
What happened when we ran it
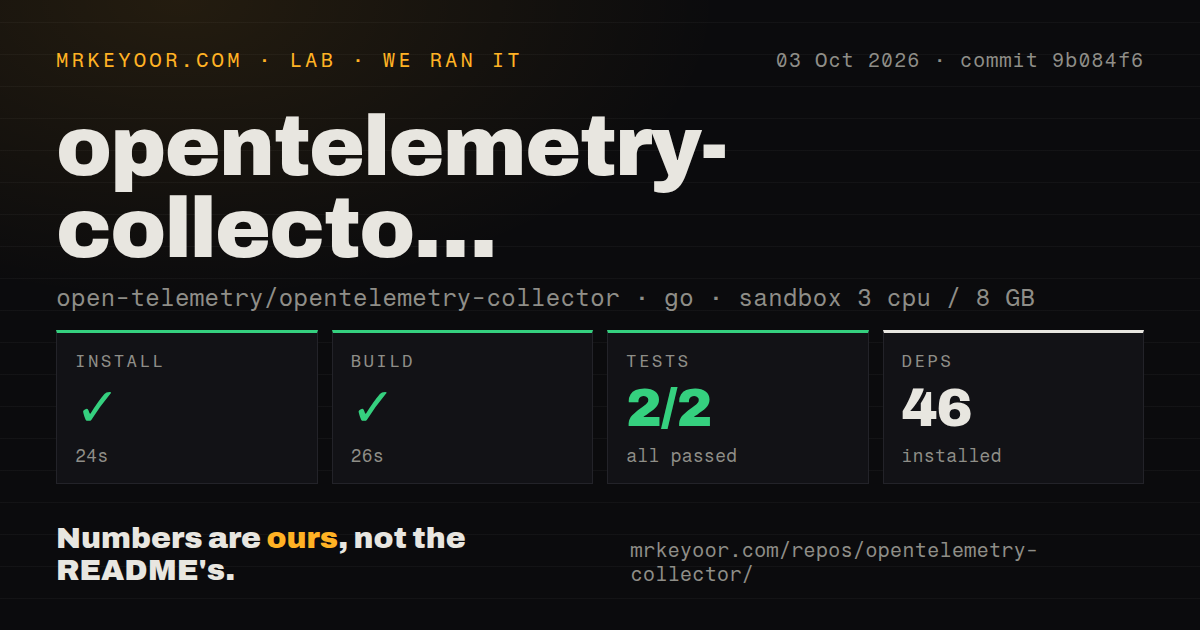
Our sandbox cloned commit 934999f and installed 55 Go packages in 48 seconds. The 11.3 MB checkout contained 2,806 files and about 261,996 lines of source. The build succeeded in 27 seconds. The available Go test step finished in 11 seconds with 1 passed and 0 failed out of 1. No install, build, or test error appeared in the measured run.
The repository had 37 CI workflow files, no Dockerfile, and no top-level tests directory in our signal scan. Those counts describe repository layout, not total upstream test coverage. One passing test is much too narrow to certify more than the command our harness found. We did not send OTLP data, load a production configuration, interrupt an exporter, fill a queue, or measure throughput. No performance claim follows from the 27-second build.
A useful local qualification should start a pinned distribution with the exact production configuration. Send known traces, metrics, and logs through every receiver, verify transformations at the destination, and compare accepted versus exported counts. Then stop the backend, exhaust retry time, restart the Collector, rotate credentials, and submit malformed or oversized payloads. The service is only dependable when its failure behavior is understood.
Queues and retries decide what happens during an outage
Exporters can retry transient errors and buffer work through sending queues, but those features need configuration and capacity. Memory queues are fast and disappear with the process. Persistent options add storage and recovery concerns. Backpressure can move upstream, while expired retries can turn into dropped telemetry. The correct queue size depends on peak input, backend outage duration, item size, and the loss the organization accepts.
Version v0.159.0 adds a feature gate for exporter-helper batching defaults and changes several queue metrics. Batch send-size histograms now describe post-batching requests, while new enqueue-size metrics preserve the earlier input view. Dashboards built around the old meaning can change after upgrade even if pipeline traffic does not. Release notes must be treated as an observability migration document, not only a binary changelog.
Internal telemetry can still make cancellation alerts noisy
The Collector emits metrics about its own receivers, processors, exporters, queues, and failures. Operators should scrape those signals separately from the data path being monitored, otherwise a Collector failure can erase its own evidence. Alert on refused or failed items, queue capacity, export errors, restarts, and configuration reloads. Logs should include component identifiers so one exporter failure does not look like a whole-service outage.
Issue #15827 points out that current universal telemetry outcomes do not clearly separate genuine pipeline failures from context cancellations. A cancellation can appear as refused upstream and failed at the exporter, creating noisy reliability alerts. The proposed changes involve a new error type or outcome value, each with cardinality or compatibility costs. Until that is settled, alert logic should correlate outcome metrics with exporter errors and shutdown events rather than counting every failure label identically.
HTTP edge cases deserve explicit negative tests
Issue #15122 describes compression handling where empty or identity settings behave incorrectly and garbage data can produce HTTP 500 instead of 400 while logging a recovered panic. The reporter says the server does not crash. This is a narrow current issue, not evidence that OTLP HTTP is generally unsafe. It is still a useful test case for any public or multi-tenant receiver: invalid compression and malformed bodies should be rejected predictably without filling logs.
GitHub showed 7,453 stars, 697 open issues and pull requests, and a last push on August 26, 2026. Release v0.159.0 arrived August 17, and the project has weekly SIG meetings with decisions recorded back in GitHub. The activity, signed artifacts, 37 workflows, and stable OTLP target justify choosing it as shared telemetry infrastructure. The operational price is continuous ownership of data loss, resource limits, configuration changes, and component upgrades.