Matplotlib is the dependable control layer for Python figures
Matplotlib has a simple job that has expanded into a large one: take values produced in Python and turn them into figures that can be inspected, presented, embedded, or published. The repository describes support for static, animated, and interactive visualization, along with output in multiple hardcopy formats and use across scripts, Python or IPython shells, web application servers, and graphical toolkits. At 23,207 GitHub stars, this is not a niche plotting experiment. It is infrastructure for people who care about exactly where an axis, label, line, legend, or panel lands.
That control is the main reason to choose it, and also the reason it can feel heavier than newer chart libraries. Matplotlib is best understood as a figure construction toolkit rather than a chart recommendation engine. It gives technical users a shared plotting base that can travel from an exploratory shell to a publication workflow. The checkout we examined was substantial: 4,575 files, about 372,803 lines of source, and 60.9 MB. That scale signals breadth, but it also means contributors should expect a real software platform, not a small utility that can be understood in one afternoon.
The README establishes scope, then sends setup detail elsewhere
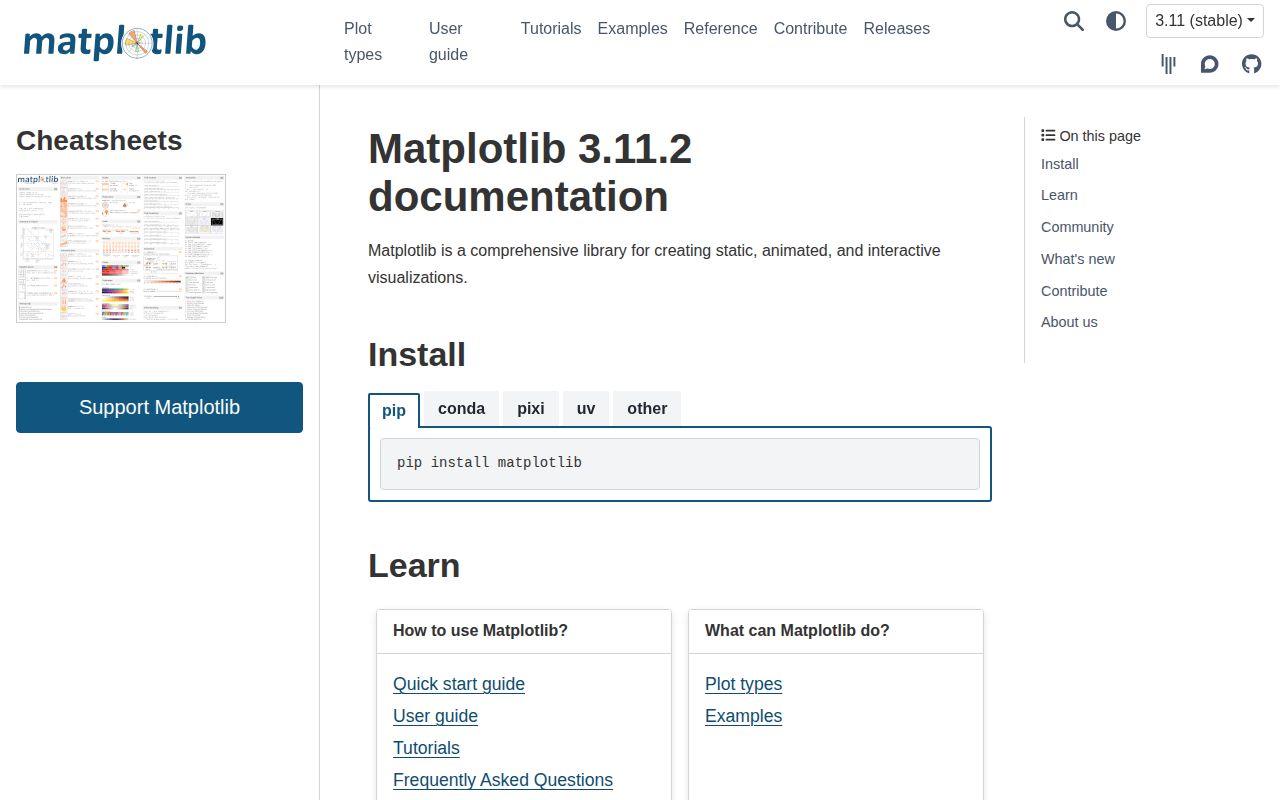
The tradeoff is that the README excerpt is a signpost, not a self-contained setup guide. Its install section points to generated documentation instead of stating prerequisites directly, and there is no Dockerfile in the repository signals we received. That is reasonable for a cross-platform Python library, but it leaves source builders dependent on the linked docs and their environment. We also found 21 CI workflow files, evidence that maintainers test across a meaningful automation surface, while our scan reported no top-level tests directory even though pytest discovered test locations under the library tree.
What happened when we ran it
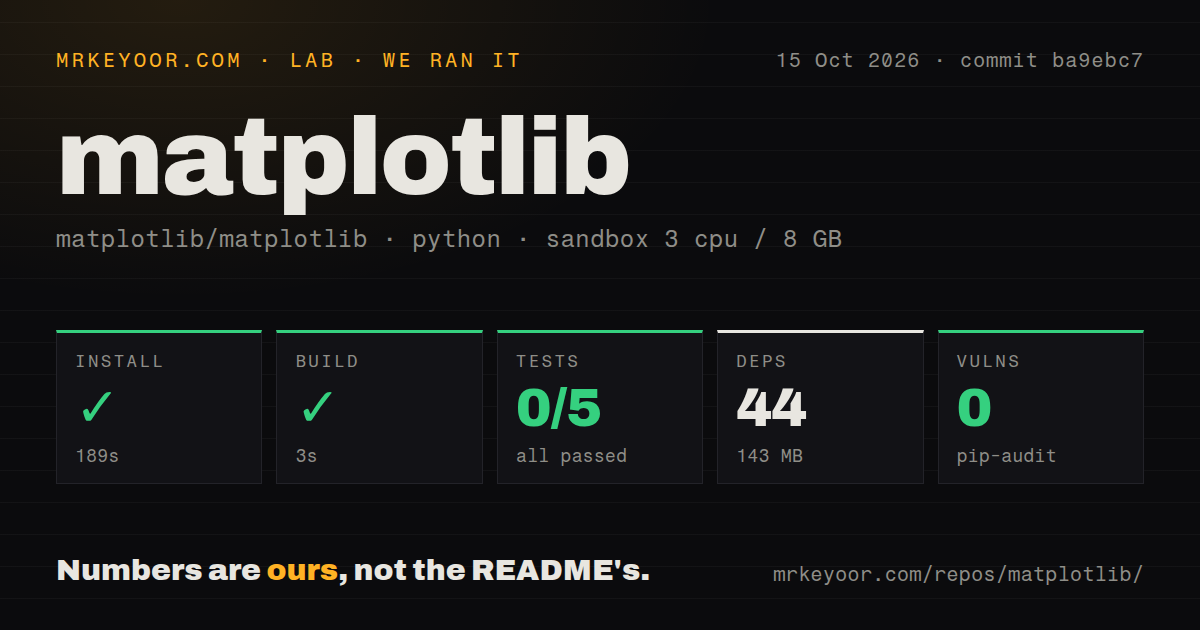
Our run used commit ff01737 in an unprivileged Debian container with Python 3.12, 3 CPUs, 8 GB of RAM, and no secrets. Installation succeeded in 222 seconds, bringing in 44 packages and consuming 143 MB on disk. The build then succeeded in 12 seconds. Those are usable results for a source checkout of this size, although the dependency and disk footprint make Matplotlib a considered addition for minimal containers rather than a negligible one. These are our measurements, not claims about every laptop or production image.
Testing was the rough edge. The test command failed after 10 seconds with 0 passed, 0 failed, and 5 collection or setup errors out of 5. Every shown error ended in a FileNotFoundError for the same specific path to a ninja executable under /work/home/.uv/builds-v0/. Pytest listed failures while collecting Matplotlib testing, Matplotlib tests, axes_grid1, axisartist, and mplot3d tests. The log proves that executable was missing at that path; it does not prove why it was missing, so we would not label this a code regression or guess at a package fix.
Its strengths are precision, portability, and multiple working contexts
Matplotlib's strongest case is continuity. A figure can begin in a Python shell, become part of a script, run on a web application server, or sit inside a GUI toolkit without changing to an entirely different visualization worldview. The README also explicitly promises publication-quality output and a variety of hardcopy formats, which matters to researchers and engineers who need more than an interactive preview. Version v3.11.1, released July 18, 2026, gives adopters a recent tagged baseline rather than forcing them onto the latest commit.
The rough edges come with age and surface area
Low-level control has a cost: teams wanting a polished interactive chart from a few columns may find Matplotlib more manual than declarative alternatives. The 143 MB installed footprint from our run can also matter in serverless images, teaching sandboxes, or tightly budgeted services. Source contributors face a deeper toolchain than the terse README suggests, as shown by the missing ninja executable that stopped all 5 collected test areas before a single assertion ran. The supplied repository metadata also marks the license as unknown, so organizations doing formal intake should verify licensing from the authoritative repository before approval.
Issue volume needs similar context. There are 1,473 open issues, which is a serious triage burden and a warning that edge cases will exist across platforms and backends. But the repository was pushed on September 9, 2026, the same day as this review, and v3.11.1 was released less than 2 months earlier. Taken together, those signals describe an active, heavily used project with a large support surface, not an abandoned one. Raw issue count alone cannot tell us response quality, and the provided data does not show closure time.
It belongs beneath analysis code, with web-first tools beside it
In a real stack, Matplotlib fits close to Python computation: after data loading and transformation, before files, reports, notebooks, or application views. It is a strong default for controlled static output and a sensible foundation when another library already expects its figure model. For browser-native exploration, choose Plotly.py or Bokeh; for concise declarative specifications, consider Altair; for a live Qt scientific interface, PyQtGraph deserves a look. None of those choices erases Matplotlib's value. The deciding question in 2026 is whether you need exact figure construction across environments or fast, opinionated interactivity in one target.
For most scientific Python teams, the answer is to keep Matplotlib available even if it is not the only visualization layer. Its build completed in 12 seconds on our box, its package audit found 0 known vulnerabilities, and its current development activity is easy to see. Just separate ordinary use from source contribution: the former looks approachable through published packages and dedicated install docs, while the latter demands that you reproduce the full toolchain and get beyond the 5 setup errors we encountered before claiming the checkout is healthy.