LeakCanary points to references that keep Android objects alive
A screen can disappear while its activity remains in memory. LeakCanary watches objects that should become collectible and analyzes a heap dump when retention deserves investigation. The result is a reference path you can follow toward the code holding an object alive. Its README describes an Android memory-leak library, and the practical appeal is receiving a diagnosis while exercising the app instead of waiting for a memory-related crash.
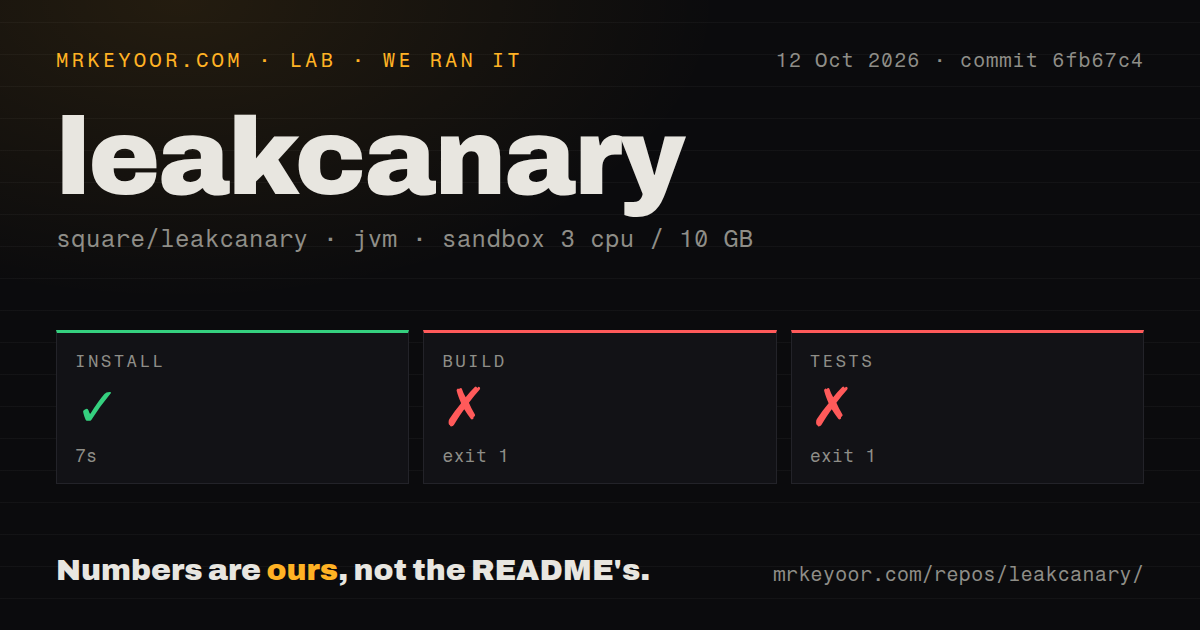
Our source-checkout build failed in 1 second because Gradle could not obtain the required Java 17 toolchain. The test command failed on the same requirement. That result matters if you want to modify LeakCanary itself. It doesn't establish whether its published Android dependency works in your app, which follows a different adoption path. I would try the debug dependency before committing to work on the upstream checkout.
The starter dependency belongs in your debug variant
The getting-started guide puts leakcanary-android under debugImplementation and says ordinary integration needs no application code change. You confirm startup through the LeakCanary tag in Logcat. Automatic watching covers destroyed activities and fragments, including fragment views, and cleared ViewModels. That makes it useful for teams investigating lifecycle mistakes during normal development, without requiring a developer to start every investigation manually.
Cloning the whole project means a different scale of work: our checkout contained 1,077 files, roughly 113,624 source lines, and occupied 218.1 MB. Those figures describe the source repository, not the size added to an Android application. The quick-start page still names the stable dependency while GitHub's latest release is an alpha. Choose your intended release line explicitly rather than treating the latest tag as an automatic upgrade recommendation.
What happened when we ran it
Our sandbox installed LeakCanary commit 6fb67c4 in 7 seconds, then the build and tests each failed with exit code 1 after 1 second. We ran it on October 12, 2026, in a fresh Debian container with 3 CPUs, 10 GB of RAM, and the lab-jvm:21 image. The container had no secrets and ran without elevated privileges. The successful install step didn't produce a successful source build.
Both logs say Gradle was unable to download a toolchain matching Java 17 because no toolchain download repository was defined. The build log also records JAVA_TOOL_OPTIONS with a 6 GB maximum heap. The reported failure concerns finding the required Java toolchain. It doesn't report an out-of-memory condition, an Android assertion failure, or a defective leak detector. A newer JVM in the container doesn't satisfy a separately requested toolchain automatically.
The scan recorded 5 CI workflow files, no Dockerfile, and no tests directory. Those detection results don't mean the repository lacks checks: our test command started and stopped on toolchain resolution. For source development, make the requested JDK available or configure provisioning, then rerun the commands. Our measurement stops at the failure, so we can't claim that either remedy would produce a green build or suite.
Heap dumps interrupt the app and still require interpretation
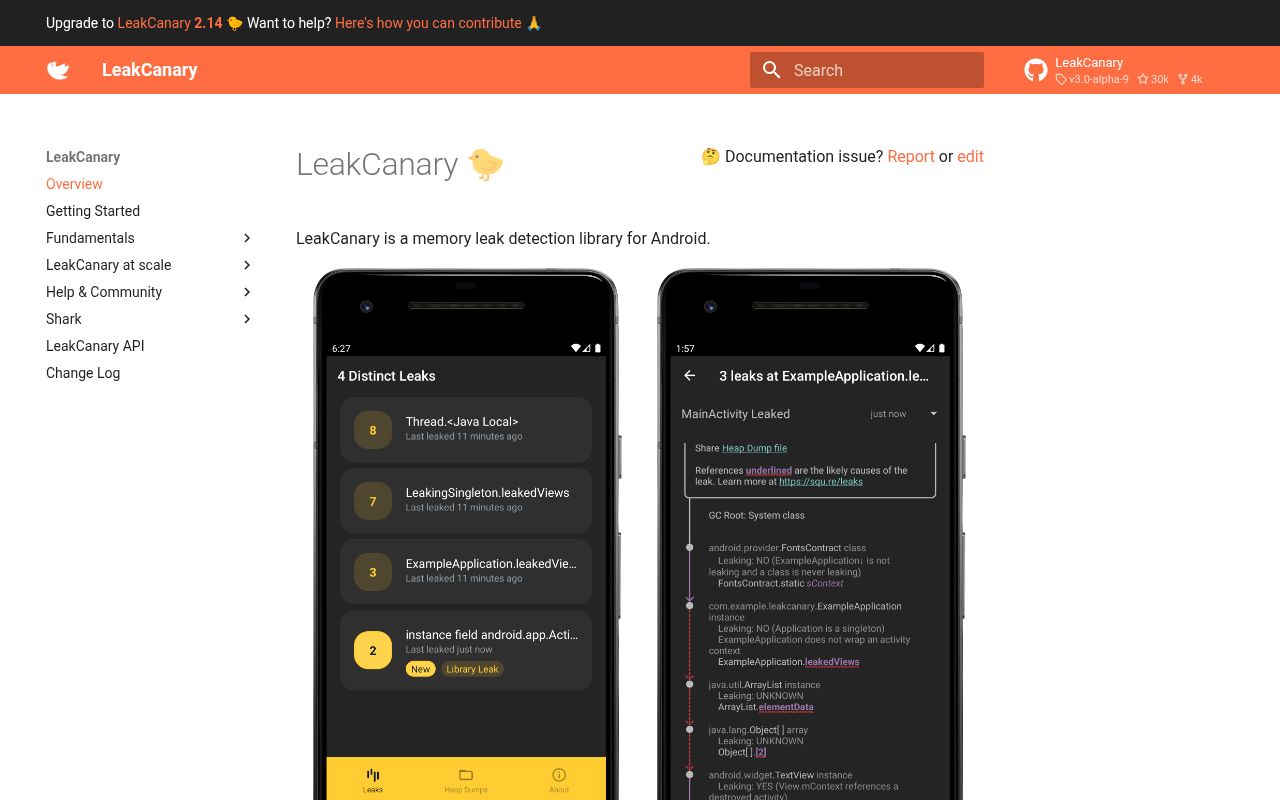
The fundamentals describe weak-reference watching, heap capture, and analysis through Shark. A leak trace follows references that prevent collection. Similar traces are grouped, and known framework or library leaks are separated from application leaks. That distinction saves you from assuming every retained activity proves a mistake in your own code. You still need to inspect the path and decide which reference should stop existing.
None of our 7-second installation result measures that diagnostic workflow. Heap capture briefly freezes the application according to the docs, which is a real interruption when reproducing a flow. Keep a note of the navigation or lifecycle action that triggered the report, then inspect the suspect reference against the relevant source. An activity held through a view's context calls for a different repair than an intentionally resident application object.
Default debugging behavior doesn't provide production monitoring
The release guide calls its production APIs experimental, with artifact names and APIs subject to change. It provides a dedicated release artifact and an optional object watcher, followed by application code for triggers and uploading analysis to Bugsnag. You'll decide when capture runs and how reports reach your service. That is additional work for a team looking for a ready-made production reporting service.
Our run used 10 GB of RAM on a Debian host, not an Android device, and supplies no device-overhead measurement. Don't transfer that memory allowance into a claim about phone requirements. LeakCanary's documented workflow examines the Java heap. If your problem is native allocation growth or a broad performance investigation, Android Studio's memory tools are the better starting point. Tencent Matrix is worth comparing when you also need Android performance plugins.
October fixes show maintenance beyond the June alpha release
GitHub records an October 12, 2026 push, 30,002 stars, and 135 open issues and PRs. The latest release is v3.0-alpha-9, published June 25. An October reference-queue proposal addresses retained-object counts that can trigger heap dumps whose analysis finds no leak. That work concerns the detector directly, rather than an unrelated component, and remains an open proposal.
The active work earns LeakCanary a place in an Android debug trial, while our 1-second source failures prevent a claim that this checkout is ready on a plain Java 21 container. Start with the documented dependency and reproduce a lifecycle flow you care about. Then use the trace to remove an unwanted reference and repeat the flow. The useful result is an explained and corrected retention path, which our sandbox did not measure.