KEDA turns an event backlog into a Kubernetes scaling signal
KEDA watches an external signal, reports a metric to Kubernetes, and lets the Horizontal Pod Autoscaler adjust replicas. Its ScaledObject custom resource links a deployment or other target to a trigger. ScaledJob handles work that should create jobs rather than resize a long-running service. The practical gain is scale to zero: an idle consumer can disappear, then return when a queue or metric crosses the configured threshold.
This belongs in the cluster control plane, not inside application code. KEDA runs an operator, metrics API server, and admission webhooks. Applications can remain ordinary containers while the operator talks to the event source. That separation is attractive when many teams use the same queue or cloud system, but it gives the platform team responsibility for trigger authentication, metric errors, polling, cooldowns, and the behavior of zero replicas.
Scale to zero is useful only when the activation path works
The dangerous moment is the first replica. A normal HPA can read pod metrics once pods exist, while an idle KEDA workload may have none. KEDA has to obtain the external signal, expose it correctly, and create capacity without help from the application. Test that path with the real broker, credentials, network policy, and an empty deployment. A configuration that scales 3 replicas to 10 can still fail at 0 to 1.
Current issue 8088 gives a concrete example. Version-1 Effective Partition Key leases written by modern .NET and Java Cosmos DB change-feed processors are not handled by the existing scaler path described there. The report says the wrong partition identifier can lead to missing metrics or scale-from-zero failures. If that exact lease format is in use, the scaler is not ready merely because a legacy lease test passes.
What happened when we ran it
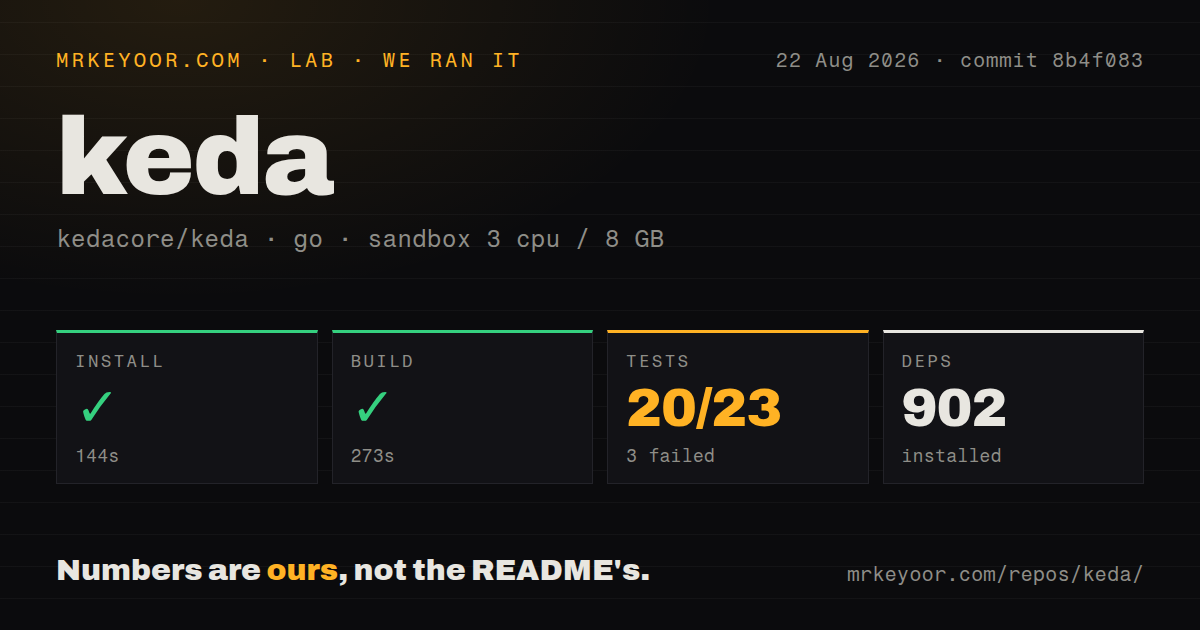
Our sandbox installed 902 Go packages in 144 seconds and built KEDA in 273 seconds. The test command ran for 80 seconds, then exited with code 1. Its summary recorded 20 passing and 3 failing packages out of 23. These measurements came from commit 8b4f083 in an unprivileged Debian container with 3 CPUs, 8 GB of RAM, no secrets, and Go 1.24.
The provided end of the log lists successful scaling packages, utility tests passing in 1.632 seconds, and several directories with no test files. It then prints only the overall FAIL. That tail does not name the three failed packages or show their assertions, so assigning a cause would be guesswork. The useful finding is limited: installation and compilation completed, while the plain test command did not pass on our box.
KEDA's own testing guide describes a wider system than our 80-second run. Pull requests run unit checks, build AMD64 and ARM64 images, and receive security and license checks. Maintainers trigger end-to-end tests, with nightly runs against Kubernetes and cloud resources in Azure, AWS, and Google Cloud. The repository included 22 CI workflow files, a Dockerfile, and a tests directory.
Local development needs certificates and a real cluster
The README points most users toward Helm, Operator Hub, or published YAML. Source contributors can use a VS Code development container or run make build with the Operator SDK version pinned by the project tooling. Running the operator outside a cluster works on Linux and macOS, but the build guide still asks for CRDs and KEDA components inside Kubernetes. It also requires local TLS certificates because the components encrypt their HTTP communication.
A full local session deploys Metrics Server, installs the CRDs, scales the in-cluster operator to 0 replicas, and starts the developer's operator against a kubeconfig. The guide separately documents the metrics server and admission webhooks. That is appropriate for control-plane software, though it means the 273-second successful build is a compile check rather than a usable demonstration. Credentials and reachable event sources still determine whether a scaler produces sensible data.
A large scaler catalog creates specific failure modes
KEDA's appeal is breadth across queues, streams, cloud services, databases, and monitoring systems. Each integration also carries its source system's authentication and semantics. Null values, partition formats, pagination, rate limits, and delayed metrics can change scaling. Open pull request 7973 describes the GitHub Runner scaler stopping after the first 100 jobs because it did not request later pages. The proposed regression case uses a 150-job run with 50 jobs still queued.
This is why choosing KEDA should start with one workload, not an organization-wide install mandate. Define what metric means work, what happens when the source is unreachable, how long zero-to-one may take, and which secret identity can read the signal. Observe both KEDA conditions and the HPA. A green operator pod does not prove that a particular trigger counts work correctly.
v2.20.2 fixes panics, reconnect loops, and wrong metrics
GitHub showed 10,471 stars, 245 combined issues and pull requests, and a last push on August 26, 2026. Release v2.20.2 was published July 31. Its fixes include several nil-pointer and cache-race panics, a concurrent map-write panic, a gRPC reconnect loop with no backoff, lost events RBAC, leaked MongoDB connections, and negative external metric handling. That list reads like production operator maintenance rather than cosmetic churn.
The same release warns users upgrading from before v2.20.0 to read the earlier upgrade notes. Treat that as part of deployment, especially because KEDA manages custom resources and participates in scaling decisions. Apache-2.0 licensing, CNCF graduated status, active issue work, and end-to-end infrastructure support a high maturity score. The failed 20-of-23 sandbox result still deserves investigation before changing or embedding the source build.