web-vitals review
web-vitals 6.2.0 observes CLS, INP, LCP, FCP, and TTFB inside a user's browser and passes metric objects to callbacks you register. It implements Chrome's lifecycle rules for buffered entries, hidden pages, prerendering, and back-forward cache restores, while the attribution build attaches relevant elements, scripts, interactions, or timing phases. Version 6 introduced experimental soft-navigation reports in supported Chromium releases. Version 6.1 added LCP Resource Timing buffering and fixed per-navigation interaction accounting. The current 6.2 patch prevents a false CLS value of 0 after a back-forward cache restore and guards `supportedEntryTypes` access in older browsers.
Our web-vitals 6.1.1 install took 0.5 seconds, left one 2 MB package, passed npm audit, and bundled to 3.3 KB gzipped; the current 6.2.0 patch fixes back-forward cache and older-browser edge cases. Install it when you own the RUM collector or need attribution, and keep Lighthouse beside it for repeatable lab testing.
We installed it
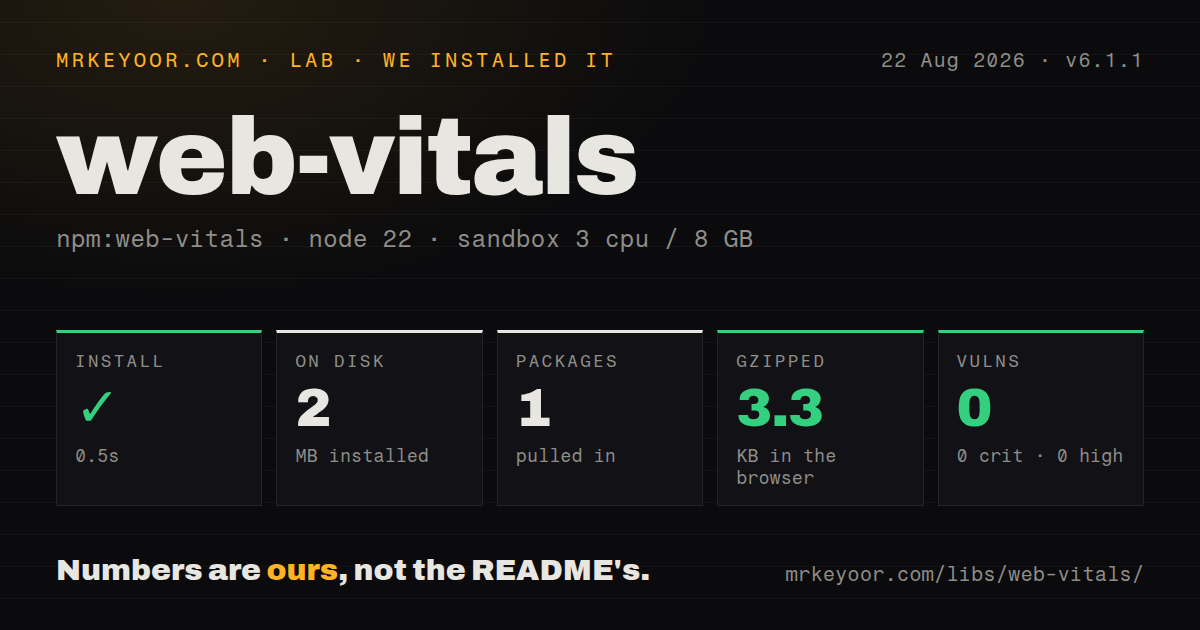
| Install | ✓ · 0.5s | 1 package on disk · 2 MB |
| Import | ✓ | ESM import works · require() works · ESM package with exports map |
| Browser | 3.3 KB | gzipped (8.7 KB minified), bundled with esbuild |
| Types | ✓ | TypeScript types bundled |
| Known vulns | 0 | 0 critical · 0 high · 0 moderate · 0 low (npm audit) |
Answers from our run
Does web-vitals install cleanly?
Yes. In a fresh container with an empty cache, npm install web-vitals finished in 0.5s, leaving 1 package and 2 MB on disk. npm audit reported no known vulnerabilities.
How much does web-vitals add to a browser bundle?
3.3 KB gzipped (8.7 KB minified) when the whole package is bundled for the browser with esbuild. Importing only part of it is usually smaller.
Does web-vitals work with both ESM and CommonJS?
Yes. Both import 'web-vitals' and require('web-vitals') worked in Node 22 in our run. The package is published as ESM with an exports map.
Does web-vitals include TypeScript types?
Yes, type declarations ship inside the package, so no @types install is needed.
web-vitals or perfume.js: which should you use?
Pick perfume.js when vitals should travel with broader navigation, resource, device, and custom performance observations. Our web-vitals 6.1.1 install took 0.5 seconds, left one 2 MB package, passed npm audit, and bundled to 3.3 KB gzipped; the current 6.2.0 patch fixes back-forward cache and older-browser edge cases.
When should you not use web-vitals?
A RUM vendor already collects these values with traces and session context. A second observer set and beacon path duplicates work and data.
Discussed on
- hnWeb Vitals: essential metrics for a healthy site165 points
- hnThe Humble img Element and Core Web Vitals57 points
- hnCore Web Vitals saved users 10k years of waiting for web pages to load49 points
- hnStart Measuring Web Vitals with Cloudflare11 points
- hnImproving Core Web Vitals, a Smashing Magazine Case Study5 points
Use it if
- A first-party RUM collector needs browser values that follow Chrome's Web Vitals implementation.
- Engineers need the shifting element, INP phases, or LCP network and render timing behind a poor value.
- A single-page app is trialing soft-navigation metrics while keeping ordinary navigation cohorts separate.
- The backend can deduplicate metric IDs and calculate page-level field distributions such as the 75th percentile.
- A RUM vendor already collects these values with traces and session context. A second observer set and beacon path duplicates work and data.
- The package is expected to supply sampling, durable queues, storage, aggregation, alerts, or charts. It stops at JavaScript callbacks.
- The requirement is a repeatable pre-release budget. Real-user metrics vary by navigation and interaction; Lighthouse is the better lab tool.
- The important work happens inside cross-origin iframes. Top-document performance APIs cannot attribute every embedded-frame contribution, so local RUM can differ from CrUX.
- Measurement code can run only in Node or during server rendering. These functions need browser performance entries and document lifecycle events.
Setup reality
We installed web-vitals 6.1.1 in a fresh Node 22 Bookworm container in 0.5 seconds. It was the only installed package and used 2 MB; npm audit reported zero critical, high, moderate, or low findings. Package metadata lists 0 direct and 0 peer dependencies, 1,680 KB unpacked, Apache-2.0, and bundled TypeScript declarations. It is ESM with an exports map, yet both require() and ESM import worked. Our full browser import produced 8.7 KB minified and 3.3 KB gzipped.
Registration belongs in client code and should run once per page lifecycle. Buffered performance entries let supported metrics observe earlier events, so the script does not need to block user-facing code. Import web-vitals/attribution only when diagnostic fields are required, or use individual metric subpaths to narrow the code. An SSR framework must keep this module out of server execution because the useful inputs are browser globals, performance observers, and document lifecycle events.
Callbacks may never fire. INP needs a qualifying interaction, and paint metrics can be absent when a page begins hidden. They may also fire again as a value changes, when the page hides, or after a back-forward cache restore. Store the metric id, value, and delta under an explicit policy: overwrite a current value by ID, or append and sum deltas. Summing repeated full values inflates the result. Version 6.2.0 specifically removes a spurious zero CLS report after cache restoration.
Soft-navigation support begins with Chromium 151, so browsers in one dataset may follow different navigation rules. Keep this experimental cohort separate and record metric.navigationURL, since the address bar can change before a delayed callback arrives. sendBeacon() helps during page hiding but has payload limits and gives no response. Select scalar fields instead of serializing raw entries. The package has no retry, storage, or aggregation layer; those remain part of your collector.
Patterns
Register the three Core Web Vitals once measure-core-vitals
import {onCLS, onINP, onLCP} from 'web-vitals';

function report(metric) {
  console.log(metric.name, metric.value, metric.rating, metric.id);
}

onCLS(report);
onINP(report);
onLCP(report);
Each registration creates page-lifetime observation work. Call these functions once from a client entry point, outside rerendering components.
Send selected metric fields to a collector send-metric-beacon
import {onCLS, onINP, onLCP} from 'web-vitals';

function send(metric) {
  const payload = JSON.stringify({
    name: metric.name,
    id: metric.id,
    value: metric.value,
    delta: metric.delta,
    rating: metric.rating,
    navigationURL: metric.navigationURL
  });
  navigator.sendBeacon('/rum/web-vitals', payload);
}

[onCLS, onINP, onLCP].forEach(register => register(send));
Raw `entries` can be large and awkward to encode. Send an allowlist of scalar fields and validate the browser-supplied payload on receipt.
Batch values when the document becomes hidden batch-hidden-page-report
const pending = new Map();
function queue(metric) {
  pending.set(`${metric.name}:${metric.id}`, metric);
}

document.addEventListener('visibilitychange', () => {
  if (document.visibilityState !== 'hidden' || pending.size === 0) return;
  const rows = [...pending.values()].map(({name, id, value, delta}) => ({name, id, value, delta}));
  navigator.sendBeacon('/rum/web-vitals', JSON.stringify(rows));
  pending.clear();
});
Mobile browsers are more likely to signal `hidden` than complete `unload`. The map keeps only the latest report for each name and ID.
Choose overwrite or delta semantics explicitly aggregate-repeat-reports
function record(metric) {
  // For an upsert store:
  upsert(metric.id, {name: metric.name, value: metric.value});

  // For an append-only analytics stream, send metric.delta instead
  // and sum deltas grouped by metric.id.
}
One metric ID can report several times. Upsert the latest full value, or append deltas; adding every full value overcounts the page.
Split INP into delay, handling, and presentation attribute-inp-delay
import {onINP} from 'web-vitals/attribution';

onINP(({value, attribution}) => {
  report({
    value,
    target: attribution.interactionTarget,
    type: attribution.interactionType,
    inputDelay: attribution.inputDelay,
    processing: attribution.processingDuration,
    presentation: attribution.presentationDelay,
    longestScript: attribution.longestScript
  });
});
Input delay, handler duration, and presentation delay point at different bottlenecks. Some attribution fields remain absent on browsers lacking the required entries.
Break LCP into network and render phases attribute-lcp-time
import {onLCP} from 'web-vitals/attribution';

onLCP(({value, attribution}) => {
  report({
    value,
    target: attribution.target,
    resource: attribution.url,
    ttfb: attribution.timeToFirstByte,
    loadDelay: attribution.resourceLoadDelay,
    loadDuration: attribution.resourceLoadDuration,
    renderDelay: attribution.elementRenderDelay
  });
});
Version 6.1 buffers Resource Timing for this attribution. The browser can still omit a resource entry, so every diagnostic field needs null-safe handling.
Capture the largest CLS shift target attribute-layout-shift
import {onCLS} from 'web-vitals/attribution';

onCLS(({value, attribution}) => {
  report({
    value,
    target: attribution.largestShiftTarget,
    shiftValue: attribution.largestShiftValue,
    shiftTime: attribution.largestShiftTime,
    loadState: attribution.loadState
  });
});
This reports the largest contributor, not the complete shift history. A page with no layout shift may have no target fields to send.
Use application identifiers for attribution targets generate-stable-target
import {onLCP} from 'web-vitals/attribution';

onLCP(report, {
  generateTarget(element) {
    return element?.getAttribute('data-rum-id');
  }
});
A missing custom ID falls back to the built-in selector. Stable data attributes avoid splitting one component across changing generated class names.
Report metric changes during local debugging debug-every-change
import {onCLS, onINP} from 'web-vitals';

onCLS(console.log, {reportAllChanges: true});
onINP(console.log, {
  reportAllChanges: true,
  durationThreshold: 16
});
`reportAllChanges` follows changes to the metric, which is different from logging every underlying event. It can multiply production beacons.
Separate hard and soft navigation callbacks measure-soft-navigation
import {onCLS, onINP, onLCP} from 'web-vitals';

for (const register of [onCLS, onINP, onLCP]) {
  register(metric => report('hard', metric));
  register(metric => report('soft', metric), {reportSoftNavs: true});
}
Only Chromium 151 and later supports this path initially. Record `navigationURL` and capability so these values do not mix with ordinary navigation cohorts.
Map metric deltas into GA4 events report-to-ga4
function sendToGA4({name, id, delta, value, rating, navigationURL}) {
  gtag('event', name, {
    value: delta,
    metric_id: id,
    metric_value: value,
    metric_rating: rating,
    page_location: navigationURL
  });
}

onCLS(sendToGA4);
onINP(sendToGA4);
onLCP(sendToGA4);
GA4 adds event values during aggregation. Send `delta` as that value and keep the latest full metric in a separate parameter.
Use the package's metric thresholds in charts read-rating-thresholds
import {CLSThresholds, INPThresholds, LCPThresholds} from 'web-vitals';

console.log(CLSThresholds);
console.log(INPThresholds);
console.log(LCPThresholds);
Each reported metric already contains its rating. The exported arrays are better suited to chart bands and alert-rule configuration.
Alternatives
| Package | Registry | Pick it when |
|---|---|---|
| perfume.js | npm | Pick it when vitals should travel with broader navigation, resource, device, and custom performance observations. |
| @vercel/speed-insights | npm | Pick it on Vercel when hosted collection and a dashboard are preferred over owning the RUM backend. |
| @sentry/browser | npm | Pick it when performance data should join an existing Sentry error, trace, and session pipeline. |
| lighthouse | npm | Pick it for controlled lab audits and CI budgets before a release reaches real users. |
More web frontend guides
postcss · react · react-dom · tailwindcss · htmlparser2 · tailwind-merge · the whole shelf →
How this guide is made: grounded in the library's documentation, release notes, changelog, and issue history, on a fixed rubric — not a hands-on install of every release. The 50 most-downloaded entries are additionally install-verified in clean containers. Corrections: contact the desk.