systeminformation review
systeminformation 5.33.4 is a dependency-free Node package that reads hardware, operating-system, process, filesystem, network, sensor, and Docker details through asynchronous functions. Much of the data comes from platform commands and files, so one call can return different fields across Linux, macOS, Windows, BSD, and SunOS. The npm registry has moved past the 5.33.1 build we measured; the public changelog attributes recent 5.33.x work to a Windows PowerShell deadlock fix, Windows disk serial handling, and the version 6 beta. Version 6 is a TypeScript rewrite with stated API breaks.
systeminformation 5.33.1 installed in 0.4 seconds as one 1 MB package with no dependencies or audit findings, while its browser bundle failed in our sandbox. Use the current 5.33.4 line for backend machine inventory, but cache broad calls, prime rate collectors, and expect missing fields on every supported operating system.
We installed it
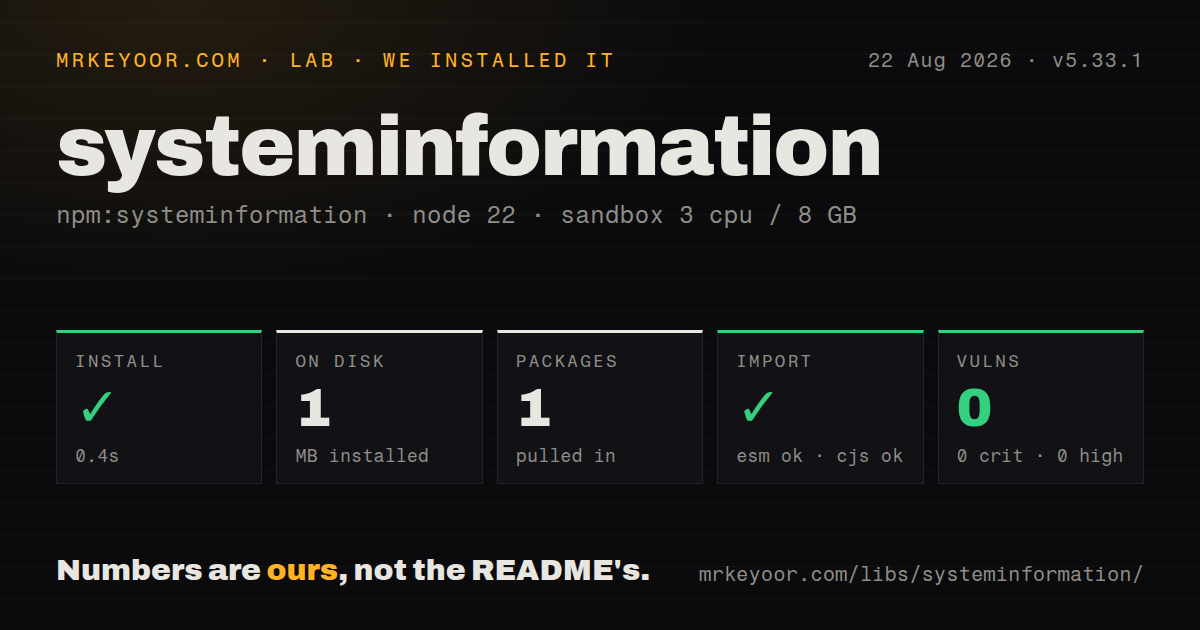

| Install | ✓ · 0.4s | 1 package on disk · 1 MB |
| Import | ✓ | ESM import works · require() works · CommonJS package |
| Browser | n/a | could not be bundled for the browser (Node-only code, most likely) |
| Types | ✓ | TypeScript types bundled |
| Known vulns | 0 | 0 critical · 0 high · 0 moderate · 0 low (npm audit) |
Answers from our run
Does systeminformation install cleanly?
Yes. In a fresh container with an empty cache, npm install systeminformation finished in 0.4s, leaving 1 package and 1 MB on disk. npm audit reported no known vulnerabilities.
Can systeminformation run in a browser?
Not directly: esbuild could not bundle it for the browser in our run, which normally means it depends on Node built-ins. Use it on the server, or find a browser-targeted alternative.
Does systeminformation work with both ESM and CommonJS?
Yes. Both import 'systeminformation' and require('systeminformation') worked in Node 22 in our run. The package is published as CommonJS.
Does systeminformation include TypeScript types?
Yes, type declarations ship inside the package, so no @types install is needed.
systeminformation or node-os-utils: which should you use?
node-os-utils: Choose it when CPU, memory, disk, and network summaries are enough and a smaller API is preferable. systeminformation 5.33.1 installed in 0.4 seconds as one 1 MB package with no dependencies or audit findings, while its browser bundle failed in our sandbox.
When should you not use systeminformation?
The code runs in a browser: the README says the library will not work there, and our esbuild browser bundle failed
Use it if
- A Node monitoring agent needs CPU load, memory, filesystems, network rates, processes, or service status from several desktop and server platforms
- Hardware inventory must include details beyond Node's `os` module, such as physical disks, graphics controllers, memory layout, battery, or USB devices
- An Electron, Bun, or Deno application needs local machine facts and can call host commands
- A small Docker overview is enough and you do not need the full Engine API
- The code runs in a browser: the README says the library will not work there, and our esbuild browser bundle failed
- Every field must exist on every operating system: the reference matrix marks support per property, and unsupported sensors often return empty or sentinel values
- The host is a stripped or locked-down container: temperature, disk health, and several Windows collectors depend on installed commands or elevated access
- You need first-call transfer rates: `networkStats()`, `fsStats()`, and `disksIO()` return null per-second values until a second sample provides a time interval
- Polling work may not spawn host commands: many collectors execute PowerShell or operating-system utilities, and broad snapshots can be slow
- You need a frozen API across the next major: the maintainer says version 6 is a TypeScript rewrite with cleanup and breaking changes
Setup reality
Our clean install of systeminformation 5.33.1 completed in 0.4 seconds. It left 1 package using 1 MB, and npm audit found 0 known vulnerabilities. The package is 892 KB unpacked with no direct or peer dependencies and declares Node 10 or newer. It is CommonJS without an exports map; both require() and ESM import worked on Node 22.23.2. TypeScript declarations ship in the package. esbuild could not produce a browser bundle, consistent with its server-only design.
A successful import does not guarantee useful sensor data. Linux temperature can require lm-sensors, while S.M.A.R.T. disk data needs smartmontools. macOS temperature support comes from a separate macos-temperature-sensor package on Apple Silicon or the older osx-temperature-sensor on Intel. Some Windows temperature and battery queries need administrator rights. Windows 11 removed WMIC, and the library now expects PowerShell 5 or newer for its Windows collectors. Version 5.33.1 specifically changes the command used for Windows network counters.
Rate fields are stateful. The first call to networkStats(), fsStats(), or disksIO() establishes counters and returns null for per-second values; the next call divides the counter change by elapsed time. Prime each collector before displaying throughput. Do not start overlapping polls when a command runs longer than the interval. Static inventory changes rarely, so cache getStaticData() instead of placing it on a public request path. The README warns that this broad hardware scan can take up to 30 seconds.
Containers expose their own view of mounts, processes, interfaces, and CPU limits, which may differ from the host the dashboard is meant to describe. Docker helpers need access to the Docker daemon; mounting its socket gives the process significant host control. Treat all returned fields as platform-dependent and validate them before formatting. mem.used and mem.active also answer different questions on Linux because caches influence the used figure. Test on every shipped operating system and privilege level as well as a developer laptop.
Patterns
Collect CPU and operating-system identity read-system-basics
const si = require('systeminformation');

const [cpu, os] = await Promise.all([si.cpu(), si.osInfo()]);
console.log({
  cpu: `${cpu.manufacturer} ${cpu.brand}`,
  cores: cpu.cores,
  platform: os.platform,
  release: os.release,
});
Most functions are asynchronous and may run platform commands. In ESM, a default import works even though the package is CommonJS.
Read total and per-core CPU load measure-current-load
const load = await si.currentLoad();
console.log(load.currentLoad);
for (const [index, core] of load.cpus.entries()) {
  console.log(index, core.load);
}
A dashboard should sample on a steady interval. Avoid firing a new collection while the previous one is unresolved because command-backed calls can overlap.
Choose a Linux memory figure deliberately report-memory
const memory = await si.mem();
console.log({
  total: memory.total,
  free: memory.free,
  used: memory.used,
  active: memory.active,
});
Linux `used` includes memory serving as cache and can look alarming. `active` is often closer to the amount a human expects, but retain both when diagnosing pressure.
Show usage for selected mounts list-filesystems
const filesystems = await si.fsSize();
const visible = filesystems
  .filter((entry) => ['/','/data'].includes(entry.mount))
  .map((entry) => ({ mount: entry.mount, use: entry.use, available: entry.available }));
console.log(visible);
Containers may return overlays and bind mounts. Filter by mount instead of assuming the first entry is the disk users care about.
Prime network counters before showing throughput sample-network-rate
const [{ iface }] = await si.networkInterfaces('default');
await si.networkStats(iface);

setInterval(async () => {
  const [stats] = await si.networkStats(iface);
  console.log({ rxPerSecond: stats.rx_sec, txPerSecond: stats.tx_sec });
}, 2000);
The first rate sample is null because there is no earlier counter. Version 5.33.1 changes the underlying Windows command used to obtain these counters.
List processes using the most CPU find-heavy-processes
const processes = await si.processes();
const top = [...processes.list]
  .sort((left, right) => right.cpu - left.cpu)
  .slice(0, 10)
  .map(({ pid, name, cpu, mem }) => ({ pid, name, cpu, mem }));
console.table(top);
Enumerating every process can be expensive and may reveal command lines or user details. Cache results and protect any endpoint that returns them.
Handle a missing CPU temperature sensor read-temperature
const temperature = await si.cpuTemperature();
if (temperature.main == null || temperature.main < 0) {
  console.log('Temperature is unavailable on this host');
} else {
  console.log(temperature.main, temperature.cores);
}
Linux may need lm-sensors, macOS needs a separate sensor package, and some Windows readings require administrator rights. Missing data is an expected platform result.
Request only the collectors a dashboard uses select-snapshot-fields
const snapshot = await si.get({
  cpu: 'manufacturer,brand,cores',
  mem: 'total,active,available',
  currentLoad: 'currentLoad',
  fsSize: '*',
});
A selected `get()` avoids running every collector. Use a comma-separated field list for a section and `*` only when the complete result is needed.
Separate boot-time inventory from live counters cache-static-data
const inventory = await si.getStaticData();

async function liveSample() {
  return si.getDynamicData('*', 'eth0');
}
The README says getStaticData can take up to 30 seconds. Cache its result and refresh it on a slow schedule instead of awaiting it in each request.
Read Docker container state and health inspect-docker-health
const containers = await si.dockerContainers(true);
for (const container of containers) {
  console.log({
    id: container.id,
    name: container.name,
    state: container.state,
    status: container.status,
  });
}
Container status was added in 5.33.0. These calls require Docker daemon access, and mounting the host socket into a container grants broad control over the host.
Check physical disk health when smartctl exists read-disk-health
const disks = await si.diskLayout();
for (const disk of disks) {
  console.log({
    device: disk.device,
    type: disk.type,
    size: disk.size,
    smartStatus: disk.smartStatus,
    temperature: disk.temperature,
  });
}
S.M.A.R.T. data needs smartmontools on Linux and macOS. An unknown or empty status may mean the command, device access, or drive support is missing.
Run a callback when selected values change observe-selected-values
si.observe(
  { currentLoad: 'currentLoad', mem: 'active,available' },
  3000,
  (value) => publishMetricUpdate(value),
);
observe owns a repeating poll. Choose an interval longer than the slowest selected collector and stop the surrounding process cleanly so polling does not outlive its consumer.
Alternatives
| Package | Registry | Pick it when |
|---|---|---|
| node-os-utils | npm | Choose it when CPU, memory, disk, and network summaries are enough and a smaller API is preferable. |
| pidusage | npm | Choose it when the requirement is CPU and memory for named process IDs rather than machine inventory. |
| dockerode | npm | Choose it when Docker operations and the full Engine API matter more than cross-platform host statistics. |
More web backend guides
urllib3 · requests · ws · anyio · httpx · undici · the whole shelf →
How this guide is made: grounded in the library's documentation, release notes, changelog, and issue history, on a fixed rubric — not a hands-on install of every release. The 50 most-downloaded entries are additionally install-verified in clean containers. Corrections: contact the desk.