
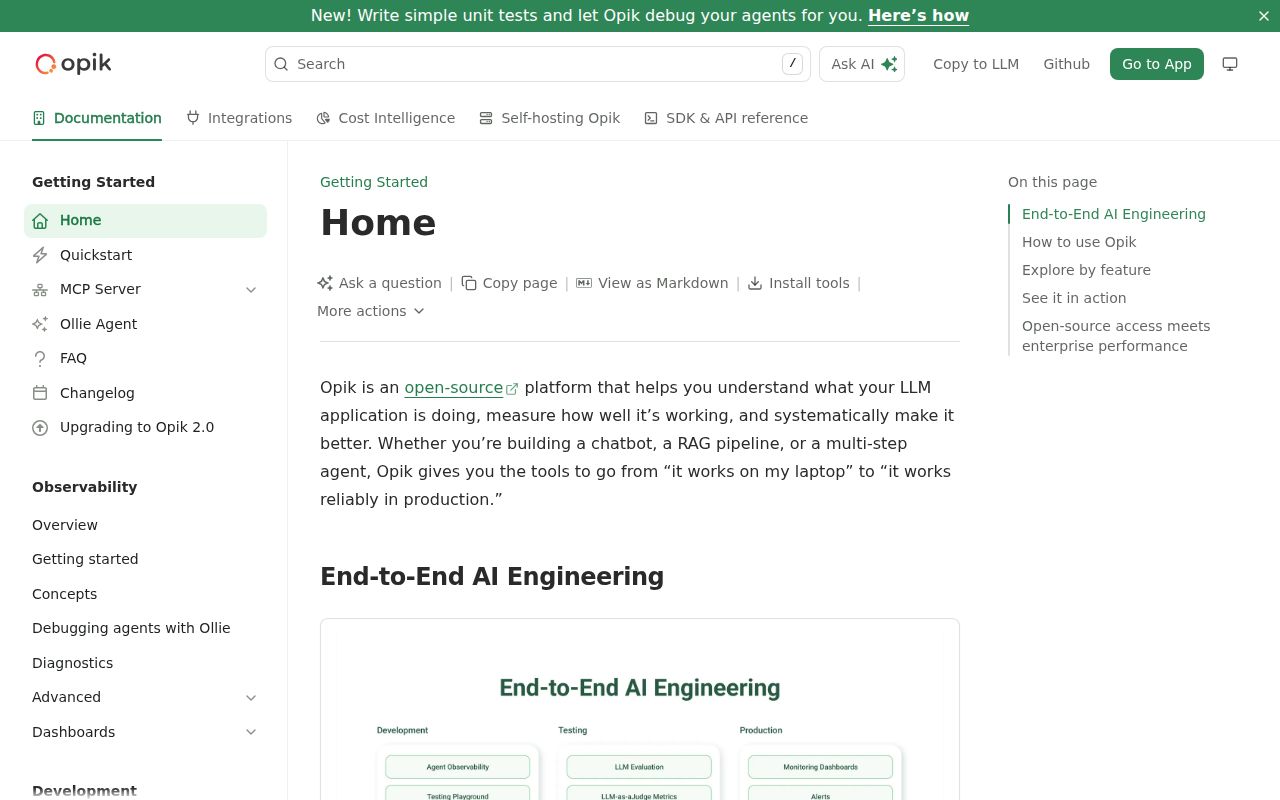
Opik joins traces, evaluations, and prompts in one product
Opik records the nested work inside an AI application: model calls, retrieval, tool use, inputs, outputs, token use, and feedback. Teams can inspect those traces, collect datasets, compare experiments, manage prompts, apply code metrics or model judges, and define online evaluation rules. That makes it more specific than ordinary logging. The stored objects match how an LLM application is debugged and judged, though they also create a sensitive new data store.
The Apache-2.0 repository includes the backend, web interface, SDKs, documentation, load tests, and deployment assets. Our checkout had 11,070 files, roughly 1,256,546 source lines, and occupied 432.4 MB before the measured install. Opik is a platform rather than a thin tracing library. The scale gives teams several ways in, but it also widens the review surface for upgrades, permissions, storage, and operational ownership.
A 24-second SDK install is not the whole server setup
The shortest path installs the Python package, runs opik configure, and adds a @track decorator. Configuration points the SDK at a local server or asks for a Comet API key and workspace. TypeScript and OpenTelemetry cover other runtimes, while direct integrations instrument agent frameworks and model clients. That is enough to judge whether the trace model is useful before committing to a self-hosted deployment.
The full server has a different shape. The README offers scripts that start Docker Compose, select infrastructure or backend services, add guardrails, verify health, and remove data volumes. Production guidance points to Kubernetes and Helm. Our repository scan found 82 CI workflow files and a tests directory but no Dockerfile, and the measured Python project lived under tests_load/. Those facts should prevent anyone from mistaking a successful package build for a full-platform deployment test.
What happened when we ran it
We cloned commit fd0a6fa into an unprivileged Debian container with 3 CPUs, 8 GB of RAM, Python 3.12, and no secrets. The tests_load/ project installed 108 packages in 24 seconds and used 539 MB. Its build succeeded in 4 seconds. Pip-audit reported 0 known vulnerabilities in that installed Python environment.
Tests ran for 157 seconds and exited with code 1. The last trace names test_traces_with_explicit_attachments, then follows the call through opik.flush_tracker(), the client streamer, and a synchronization wait. Pytest's timeout handler ended the test while it was sleeping for completion. The log does not say whether the delay came from a missing service, networking, or the client itself, so the defensible finding is that this attachment load test did not finish in our sandbox.
The run did not start Opik's entire web and backend stack, provision its databases, or test every SDK. It measured the supplied Python load-test project only. The 28 seconds of successful install and build work establish that its package environment resolved and compiled. The later timeout says the trace-flush path needs a representative connected deployment before a team can trust attachment workloads or shutdown behavior.
Self-hosting keeps traces close and adds data duties
Opik's strongest argument is control. An organization can keep the platform in its infrastructure and send traces from Python, TypeScript, Java, Ruby, .NET, or another OpenTelemetry-capable runtime. Framework integrations reduce custom instrumentation for common agent stacks. MCP support lets clients such as Claude Code query or operate Opik through a tool interface, which is why both mcp and claude-code belong in this review's tags.
Trace ownership also means governance ownership. Prompts may include personal data, internal documents, credentials accidentally passed to tools, or model outputs that should not be visible to every developer. Before routing production traffic, set authentication, workspace boundaries, retention, deletion, backups, encryption, and redaction rules. A platform that makes debugging easier can simultaneously make sensitive conversations easier to search.
v2.2.41 shipped with backend, SDK, and QA changes
Release 2.2.41 was published on August 26, 2026, the same date as the latest repository push. Its notes span backend data work, end-to-end coverage, Python SDK analytics, Cursor token reporting, dependency updates, and provider definitions. GitHub showed 21,616 stars and 218 open issues and pull requests. Recent activity included MCP setup, Anthropic streaming, Vertex AI dependencies, dataset sizing, and prompt-injection tests.
That pace indicates active work across the product, not merely documentation maintenance. It also creates upgrade pressure for a self-hosted installation with several services and SDKs. Teams should pin server and client versions, read database migration notes, and test trace compatibility before rolling forward. The latest release alone does not establish operational stability, while same-day code and issue activity make abandonment an implausible concern.
Opik makes sense once evaluation work has an owner
Tracing is easy to add and easy to neglect. Opik becomes useful when someone defines datasets, reviews failed traces, maintains score rules, and connects findings to releases. Without that practice, the platform becomes an expensive archive of prompts. Its dashboards and integrations cannot decide which behavior is acceptable for your users or whether a model judge agrees with human reviewers.
Choose Opik when one team needs a shared system for observation and evaluation, especially when self-hosting or Apache-2.0 licensing is a requirement. Compare Langfuse and Phoenix with the same production traces before settling on schemas and SDKs. Our 157-second timeout is not a verdict on the full platform, but it is enough reason to test attachment flushing, service loss, and process shutdown under the deployment you plan to operate.