hot-shots review
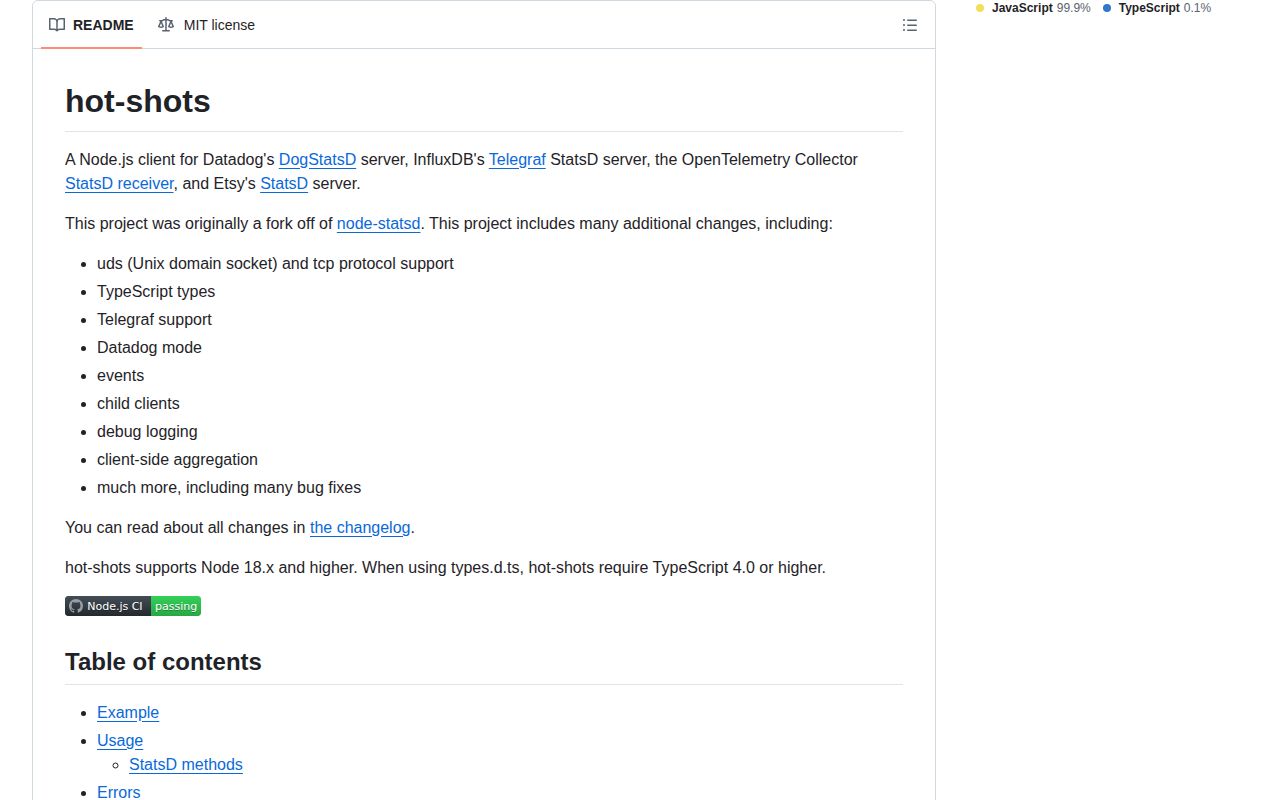
hot-shots 17.1.0 is a Node 18+ StatsD client that sends counters, gauges, sets, timings, histograms, and backend-specific events to DogStatsD, Telegraf, an OpenTelemetry Collector StatsD receiver, or classic StatsD. UDP, TCP, Unix sockets, and caller-provided streams are supported. Version 17 adds explicit Datadog mode, environment-based auto-detection, client telemetry, origin and cardinality fields, plus client-side aggregation and a public `flush()`. Our browser build failed because the package depends on Node networking, which is the correct platform boundary for a metrics transport.
hot-shots 17.1.0 installed in 10.7 seconds with 0 audit findings, while its browser bundle failed because this is Node-only networking code. Install it when a StatsD receiver is already real infrastructure; a successful local send is not a durability guarantee.
We installed it
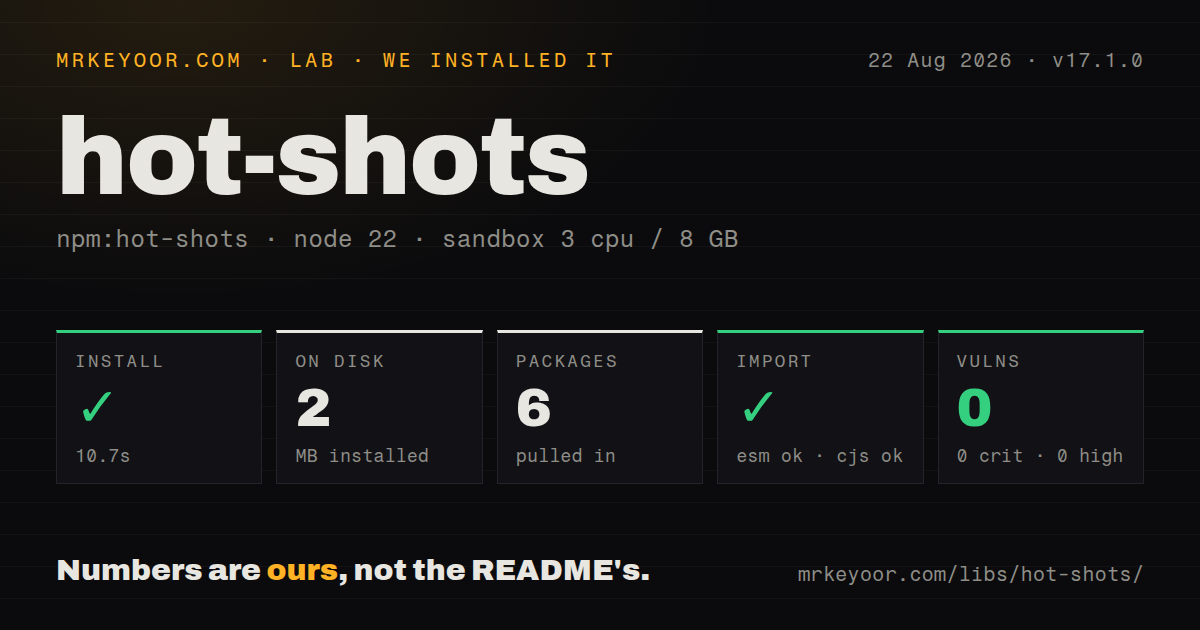
| Install | ✓ · 10.7s | 6 packages on disk · 2 MB |
| Import | ✓ | ESM import works · require() works · CommonJS package with exports map |
| Browser | n/a | could not be bundled for the browser (Node-only code, most likely) |
| Types | ✓ | TypeScript types bundled |
| Known vulns | 0 | 0 critical · 0 high · 0 moderate · 0 low (npm audit) |
Answers from our run
Does hot-shots install cleanly?
Yes. In a fresh container with an empty cache, npm install hot-shots finished in 11 seconds, leaving 6 packages and 2 MB on disk. npm audit reported no known vulnerabilities.
Can hot-shots run in a browser?
Not directly: esbuild could not bundle it for the browser in our run, which normally means it depends on Node built-ins. Use it on the server, or find a browser-targeted alternative.
Does hot-shots work with both ESM and CommonJS?
Yes. Both import 'hot-shots' and require('hot-shots') worked in Node 22 in our run. The package is published as CommonJS with an exports map.
Does hot-shots include TypeScript types?
Yes, type declarations ship inside the package, so no @types install is needed.
hot-shots or @opentelemetry/sdk-metrics: which should you use?
@opentelemetry/sdk-metrics: Use it for vendor-neutral instruments, views, resources, and exporters alongside OTel traces. hot-shots 17.1.0 installed in 10.7 seconds with 0 audit findings, while its browser bundle failed because this is Node-only networking code.
When should you not use hot-shots?
No StatsD agent or collector is deployed; the default UDP client can send to localhost while nothing records the packets
Use it if
- Your platform already runs a local StatsD-compatible agent and Node services need a small emission client
- DogStatsD distributions, events, service checks, tags, or Unix socket delivery are required
- High-rate counters and gauges would benefit from buffering or client-side aggregation
- One codebase must switch among Datadog, Telegraf, OTel Collector, and classic StatsD line formats
- No StatsD agent or collector is deployed; the default UDP client can send to localhost while nothing records the packets
- You require durable delivery acknowledgements because a local socket callback does not prove the backend stored a metric
- The target is a browser, edge isolate, or Node 16; version 17.1.0 requires Node 18 and uses Node networking
- Windows or a locked container must use Unix sockets; the documented UDS path relies on platform support and a mounted agent socket
- Your instrumentation standard is OpenTelemetry metrics end to end and a StatsD translation hop adds no compatibility value
Setup reality
We installed hot-shots 17.1.0 in 10.7 seconds; it left 6 packages using 2 MB on disk. The package was 232 KB unpacked with 0 declared direct dependencies and 0 peers. npm audit found 0 known vulnerabilities. It is CommonJS behind an exports map; require() and ESM import worked, and declarations are bundled. The package requires Node >=18.0.0.
Installation does not provide a metrics daemon. Without transport options, the client reads recognized Datadog environment variables or sends UDP toward local port 8125. Pick the receiving protocol first because DogStatsD, Telegraf, the OTel StatsD receiver, and classic StatsD disagree on tags, histograms, events, checks, and timestamps. Set an errorHandler on the root client and keep tag values bounded.
UDP and TCP default to no buffering; UDS defaults to an 8,192-byte buffer and a 1,000ms flush interval. With buffering, a per-metric callback means queued, not delivered. Later send failures go to errorHandler. Aggregation delays eligible counters, gauges, and sets; metrics with timestamps, per-call sampling, or unsupported types bypass it. Call flush() when a short-lived process may freeze before the interval fires.
Our esbuild browser attempt failed, consistent with Node-only socket code. Metrics emitted from a process exit handler cannot finish asynchronous work. Handle SIGTERM or SIGINT, stop accepting requests, call close(), and wait for its callback. A close callback that receives a flush error may run before the socket closes, so failure handling must not assume cleanup finished.
Patterns
Connect to an explicit UDP agent create-client
import StatsD from 'hot-shots'

const metrics = new StatsD({
  host: process.env.STATSD_HOST,
  port: 8125,
  prefix: 'checkout.',
  globalTags: { env: process.env.NODE_ENV, service: 'api' },
  errorHandler: (error) => console.error('StatsD error', error),
})
If no host or recognized Datadog variable is set, UDP points at localhost; verify an agent listens on port 8125.
Count a tagged request increment-counter
metrics.increment('requests', 1, {
  tags: { route: '/orders', status: '200' },
})
Keep tags low-cardinality. A request ID or user ID can create an unbounded number of metric contexts.
Measure an asynchronous function record-timing
const timedFetch = metrics.asyncTimer(async (url, context) => {
  const response = await fetch(url)
  context.addTags({ status: response.status })
  return response.json()
}, 'upstream.duration')

const data = await timedFetch(url)
The wrapper appends a metric context argument; functions that depend on an exact argument list need an adapter.
Scope metrics to one subsystem create-child-client
const payments = metrics.childClient({
  prefix: 'payments.',
  globalTags: { component: 'payments' },
})
payments.increment('attempts')
Child clients share the parent socket and aggregator, while their tags create separate aggregation contexts.
Combine hot counters before transport enable-aggregation
const metrics = new StatsD({
  aggregation: { flushInterval: 2000, maxContexts: 5000 },
  errorHandler: console.error,
})
Counts, gauges, and sets can aggregate; timings, histograms, events, checks, timestamps, and per-call sampling bypass it.
Send DogStatsD through UDS use-unix-socket
const metrics = new StatsD({
  datadog: true,
  protocol: 'uds',
  path: '/var/run/datadog/dsd.socket',
  udsRetryOptions: { retries: 3, retryDelayMs: 100 },
  errorHandler: console.error,
})
The agent socket must be mounted and writable; UDS also defaults to an 8,192-byte buffer rather than immediate sends.
Capture lines without a socket test-with-mock
const metrics = new StatsD({ mock: true })
metrics.increment('jobs.completed', { queue: 'email' })
expect(metrics.mockBuffer).toContain('jobs.completed:1|c|#queue:email')
metrics.mockBuffer.length = 0
`mockBuffer` grows until your test clears it, so reset the array between cases.
Wait for metrics during SIGTERM close-gracefully
process.once('SIGTERM', () => {
  metrics.close((error) => {
    if (error) console.error('metrics close failed', error)
    process.exit(error ? 1 : 0)
  })
})
Do this before Node's `exit` event. If flushing fails, the callback may run before the socket has closed.
Alternatives
| Package | Registry | Pick it when |
|---|---|---|
| @opentelemetry/sdk-metrics | npm | Use it for vendor-neutral instruments, views, resources, and exporters alongside OTel traces. |
| prom-client | npm | Use it when Prometheus will scrape each Node process instead of receiving pushed StatsD packets. |
| datadog-metrics | npm | Use it when a Datadog-only service must submit through HTTP without a local DogStatsD agent. |
More web backend guides
urllib3 · requests · ws · anyio · httpx · undici · the whole shelf →
How this guide is made: grounded in the library's documentation, release notes, changelog, and issue history, on a fixed rubric — not a hands-on install of every release. The 50 most-downloaded entries are additionally install-verified in clean containers. Corrections: contact the desk.