coverage review
Coverage.py 7.15.4 records which Python statements and branches execute, then turns that data into terminal, HTML, XML, JSON, LCOV, or Markdown reports. It works below test runners, so the same engine can measure pytest, unittest, command-line programs, and code started through its Python API. The 7.15.4 release fixes escaping for unusual filenames in HTML and LCOV output and supplies Python 3.15 wheels. Our Python 3.12 sandbox loaded the typed package successfully, including its compiled tracer.
Coverage.py 7.15.4 installed in 0.2 seconds and used 1 MB in our sandbox, with zero pip-audit findings and a working typed import. Install it for runner-independent Python measurement; choose pytest-cov when pytest flags are the only interface your team wants.
We installed it
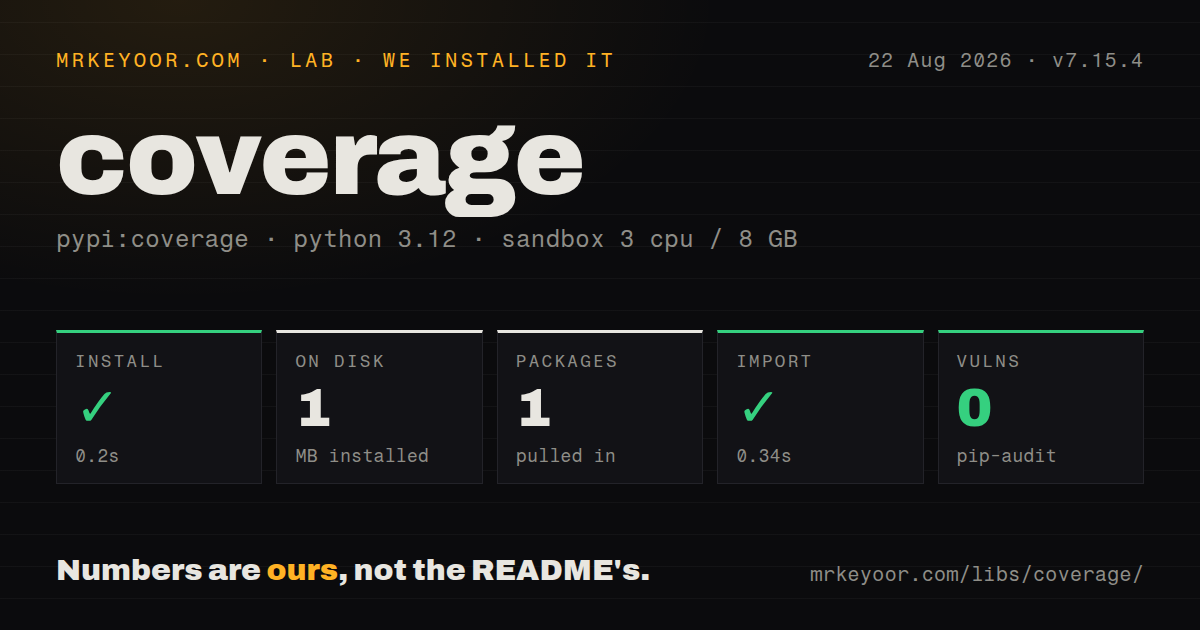
| Install | ✓ · 0.2s | 1 package on disk · 1 MB |
| Import | ✓ | import coverage in 0.34s · compiled extensions · py.typed · requires Python >=3.10 |
| Known vulns | 0 | (pip-audit) |
Answers from our run
Does coverage install cleanly?
Yes. In a fresh container with an empty cache, pip install coverage finished in 0.2s, leaving 1 package and 1 MB on disk. pip-audit reported no known vulnerabilities.
What does coverage need to run?
Python >=3.10, and a platform wheel with compiled extensions. In our run import coverage succeeded in 0.34s, and the package ships py.typed for type checkers.
coverage or pytest-cov: which should you use?
Pick pytest-cov when pytest is the only runner and its flags and worker integration are the desired interface. Coverage.py 7.15.4 installed in 0.2 seconds and used 1 MB in our sandbox, with zero pip-audit findings and a working typed import.
When should you not use coverage?
Your entire workflow is pytest and you want worker handling plus short --cov flags. pytest-cov provides that runner integration on top of Coverage.py.
Use it if
- One measurement tool must work with pytest, unittest, scripts, and application entry points.
- CI needs an exact minimum percentage plus XML, JSON, LCOV, or Markdown output for another service.
- A test suite spans subprocesses or workers whose separate data files must become one report.
- You need branch results or per-test contexts, not a simple list of executed lines.
- Your entire workflow is pytest and you want worker handling plus short `--cov` flags. pytest-cov provides that runner integration on top of Coverage.py.
- The code under test is mainly JavaScript, templates, or native extension internals. Coverage.py observes Python source execution, not those other layers.
- A percentage is being used as a proxy for assertion quality. This tool can prove a line ran, but it cannot prove that the test checked the right outcome.
- Dynamic contexts or file-tracer plugins are required with the sysmon core. The documented sysmon limitations exclude those features.
- Your packaging policy forbids compiled artifacts. The wheel in our install contained a `.so`, even though a slower Python tracer exists as a fallback.
Setup reality
We installed Coverage.py 7.15.4 in a clean Python 3.12 Bookworm container in 0.2 seconds. The result was one package and 1 MB on disk. pip-audit reported zero known vulnerabilities. It declares one direct dependency, requires Python 3.10 or later, includes py.typed, and ships a compiled extension. import coverage completed in 0.34 seconds on our box. The license is Apache-2.0.
There are no credentials or hosted accounts to configure. Keep run and report settings together in pyproject.toml, and set source so imported dependencies do not swell the denominator. Line measurement is the default; branch measurement needs branch = true. Put .coverage* and generated report directories outside version control. A decimal fail_under value also needs suitable precision if you want the displayed percentage to explain the exit code.
A parent launched with coverage run does not automatically measure every child. The current patch = ["subprocess"] option prepares Python subprocess startup and creates parallel data files. Multiprocessing needs its matching concurrency setting. Coverage 7 reporting commands can combine those files automatically, but a hard-killed child may exit before its buffered data reaches disk.
CI paths cause more confusion than installation. The same module can appear twice when a container, an editable install, and a checkout use different absolute paths. Enable relative files and define path aliases before merging jobs. Python 3.12 can use the sysmon core, and Python 3.14 selects it by default, but plugins, dynamic contexts, and some concurrency modes still require another core.
Patterns
Run pytest under the tracer measure-pytest
coverage run -m pytest
coverage report -m
`report -m` lists missed lines. Add branch configuration when executed statements alone are too coarse.
Set source, branches, and the CI floor configure-pyproject
[tool.coverage.run]
source = ["myapp"]
branch = true
relative_files = true

[tool.coverage.report]
show_missing = true
fail_under = 85
precision = 1
`source` controls which application code belongs in the denominator. `precision = 1` makes a decimal threshold visible in the printed total.
Create an HTML drill-down generate-html
coverage run -m pytest
coverage html -d htmlcov
python -m http.server --directory htmlcov 8000
The generated `htmlcov/` directory contains source views and should normally stay out of Git.
Write XML before enforcing the floor enforce-threshold
coverage run -m pytest
coverage xml -o coverage.xml
coverage report --fail-under=85
Generate the upload artifact first. The last command returns a nonzero status when total coverage is below 85 percent.
Enable Python child-process measurement measure-subprocesses
[tool.coverage.run]
source = ["myapp"]
patch = ["subprocess"]
Subprocess patching enables parallel data files. Child interpreters still need a normal shutdown to save buffered results.
Merge worker result files explicitly combine-data
coverage combine --keep
coverage report -m
Current 7.x report commands can combine automatically. `--keep` retains the original pieces when debugging a missing worker.
Unify checkout and container paths map-ci-paths
[tool.coverage.run]
relative_files = true

[tool.coverage.paths]
source = [
  "src/",
  "/workspace/src/",
  "*/site-packages/myapp/",
]
Coverage writes the first spelling as canonical, preventing one file from appearing under multiple absolute paths after combination.
Add project-specific exclusions exclude-lines
[tool.coverage.report]
exclude_also = [
  "if TYPE_CHECKING:",
  "raise NotImplementedError",
]
Use `exclude_also` to preserve the built-in patterns. `exclude_lines` replaces the defaults.
Associate lines with test functions record-test-contexts
[tool.coverage.run]
dynamic_context = "test_function"

[tool.coverage.html]
show_contexts = true
Dynamic contexts increase stored data and are unavailable with sysmon. Turn them on for attribution work rather than every routine run.
Try the sysmon core select-core
COVERAGE_CORE=sysmon coverage run -m pytest
coverage debug sys
Sysmon requires Python 3.12 or newer. Current docs exclude plugins, dynamic contexts, and some concurrency settings.
Measure a custom operation use-python-api
from coverage import Coverage

cov = Coverage(source=["myapp"], branch=True)
cov.start()
try:
    run_job()
finally:
    cov.stop()
    cov.save()

cov.report(show_missing=True)
Start before importing code with module-level work. The `finally` block saves measurements when `run_job()` raises.
Read totals from JSON emit-json
coverage run -m pytest
coverage json -o coverage.json
python -c "import json; d=json.load(open('coverage.json')); print(d['totals']['percent_covered_display'])"
Read documented JSON fields instead of scraping the terminal table, whose spacing and rounding are presentation details.
Alternatives
| Package | Registry | Pick it when |
|---|---|---|
| pytest-cov | PyPI | Pick it when pytest is the only runner and its flags and worker integration are the desired interface. |
| diff-cover | PyPI | Pick it to enforce changed-line coverage from an existing XML report, without replacing the measurement engine. |
| covdefaults | PyPI | Pick it to share opinionated Coverage.py defaults across projects, while retaining Coverage.py as the engine. |
More testing guides
pytest · chai · vitest · jsdom · playwright · axe-core · the whole shelf →
How this guide is made: grounded in the library's documentation, release notes, changelog, and issue history, on a fixed rubric — not a hands-on install of every release. The 50 most-downloaded entries are additionally install-verified in clean containers. Corrections: contact the desk.