mrkeyoor.com_
Mon 28 Sept 13:42 UTC
Self-Hostedevaluationupdated 28 Sept 2026

CF-Server-Monitor review

CF-Server-Monitor is a Chinese-first server monitoring dashboard with a full English README and an English interface. It sends host metrics to Cloudflare Workers, stores history in D1, and pushes live updates through Durable Objects, so you do not have to operate a separate monitoring server.

Verdict

Our 15-second install ended with a failed build and 8 failed tests out of 56, so CF-Server-Monitor has not earned an unattended production deployment on our evidence. It is still a sensible trial for a small Cloudflare-based fleet when one-way reporting matters more than remote control. Wait or test carefully if Cloudflare Access, long retention, or repeatable builds are requirements.

We ran it

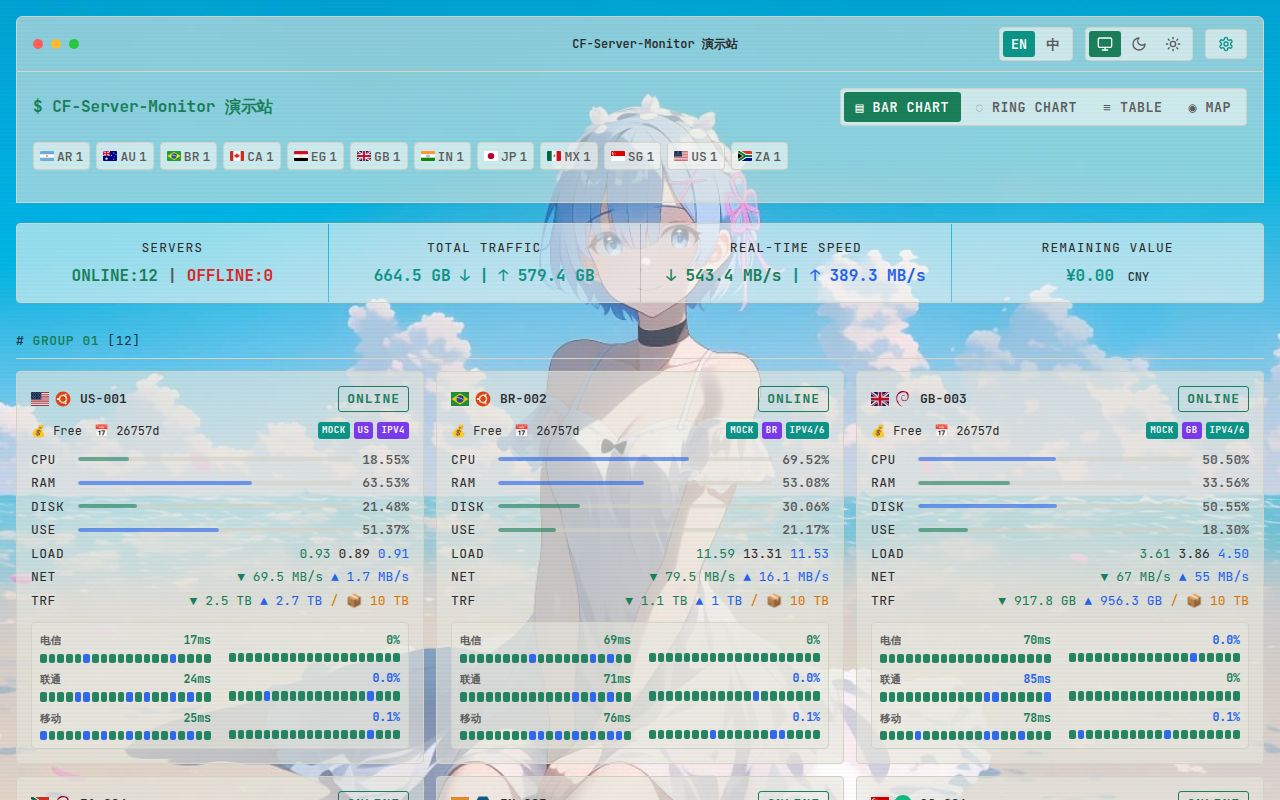
Lab card: what happened when we ran CF-Server-MonitorScreenshot of CF-Server-Monitor (demo.huilang.me)
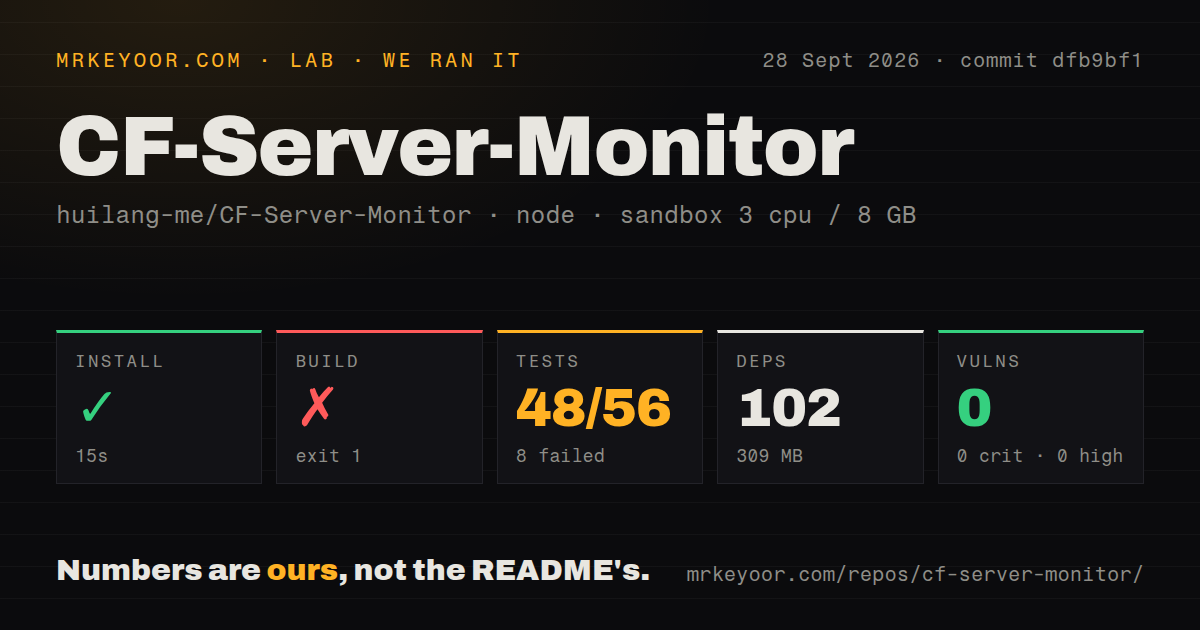
Install✓ · 15s102 packages · 309 MB
Build✗ · 4s
Tests✗ · 7s48 passed · 8 failed of 56 (node:test)
Known vulns00 critical · 0 high · 0 moderate · 0 low (npm audit)
Repo425 files~40,659 lines of source · 5.1 MB · 3 CI workflows · tests dir

Answers from our run

Does CF-Server-Monitor build from source?

Dependencies installed in 15 seconds (102 packages), and the build failed. We cloned commit dfb9bf1 into a clean Debian container with 3 CPUs and no project-specific setup.

Do CF-Server-Monitor's tests pass?

Not all of them: 48 of 56 passed and 8 failed when we ran the project's own test command (node:test). Some failures need services or credentials a bare container does not have.

Does CF-Server-Monitor have known vulnerabilities in its dependencies?

npm audit found none in the dependency tree at the time of our run.

Who should not use CF-Server-Monitor?

Operators who need WebSSH, remote command execution, or a controller channel: the project deliberately excludes all three.

What are the alternatives to CF-Server-Monitor?

Beszel, Uptime Kuma, Nezha. Our 15-second install ended with a failed build and 8 failed tests out of 56, so CF-Server-Monitor has not earned an unattended production deployment on our evidence.

Setup2/5Install passed, but build and 8 of 56 tests failed
Docs5/5Detailed Chinese and English setup, security, and agent docs
Community4/52,296 stars and issue activity on September 28, 2026
Maturity2/5Young project with no panel release and a failing lab baseline

Who it’s for

People already using Cloudflare who want one dashboard for small fleets of Linux, Windows, macOS, NAS, or router hosts.
Operators who prefer an agent that only reports metrics and cannot open a remote shell or accept commands.
Hobbyists and small teams willing to trade a conventional monitoring VM for Workers, D1, and Durable Objects.
Users who want offline, resource, traffic, and server-expiry alerts without assembling several services.

Who it’s NOT for

Operators who need WebSSH, remote command execution, or a controller channel: the project deliberately excludes all three.
Teams that need the whole panel in a local Docker stack: the repository has no Dockerfile, and the documented Docker command installs only the host agent.
Fleets that need a firm free-tier capacity guarantee: the README estimates roughly 60 servers at 60-second reporting and calls double that at 120 seconds theoretical.
Cloudflare Access users who need a settled private-admin path today: open issue 109 reports an authentication callback that can leave /admin refreshing in a loop.
Buyers who require tagged panel releases and a green local baseline: the repository has no GitHub release, while our measured build and 8 of 56 tests failed.

Setup reality

Our sandbox install of commit dfb9bf1 succeeded in 15 seconds, adding 102 packages and using 309 MB. The build failed with exit code 1 after 4 seconds. The test command failed after 7 seconds, with 48 passing and 8 failing out of 56. Npm audit reported 0 known vulnerabilities.

The build tail showed an ESM loader stack and ended with Node.js v18.20.8, but it did not include the underlying error. The test tail listed successful cases 45 through 56 rather than the 8 failure messages, so those excerpts do not establish a cause.

A real deployment needs Cloudflare and GitHub accounts, a Worker, D1, Durable Objects, an API_SECRET, and an agent on every watched host. GitHub Actions deployment also needs a Cloudflare token, account ID, and D1 database ID. The repository has 3 CI workflows but no Dockerfile for the panel.

Cloudflare replaces the monitoring server

At a 60-second reporting interval, CF-Server-Monitor sends each host's metrics to a Worker, writes history to D1, and pushes live changes through a Durable Object. The browser reads that same API for dashboard cards, detail charts, maps, and admin work. There is no monitoring VM to patch or database container to back up. For someone already comfortable with Cloudflare, that is the project's sharpest reason to exist.

The dashboard covers CPU, memory, swap, disk, disk IO, network use, load, process count, and uptime. Seven-day charts sit beside sampled longer-range data, monthly traffic, latency, and packet-loss views. Alerts cover offline hosts, recovery, expiry, and resource thresholds. The English README is complete rather than a short translation, and the interface can switch between Chinese and English.

One-way agents give up remote control on purpose

Since v2.8.3, the default collector has been the separate Go agent, though legacy shell and PowerShell agents remain available for cleanup. It reports outward and exposes no WebSSH, command delivery, or controller channel. That removes an entire class of admin features, but it also means compromising the dashboard does not automatically provide a terminal on every watched server.

The agent supports mainstream Linux distributions, OpenWrt, FreeBSD, macOS, Windows, Synology DSM, and Feiniu fnOS. Linux systems with systemd --user can run it without root, with files under ~/.cf-probe/. Docker is also documented for the agent. That distinction matters: the checkout contains no Dockerfile for the Worker dashboard, so the container route does not turn the whole system into a local one-command stack.

What happened when we ran it

Our sandbox installed commit dfb9bf1 in 15 seconds, pulling 102 packages and using 309 MB on disk. The build failed with exit code 1 in 4 seconds. Tests also returned exit code 1 after 7 seconds: Node's test runner counted 48 passing and 8 failing tests out of 56. Npm audit found 0 known vulnerabilities at the time of this run.

The 5.1 MB checkout held 425 files and about 40,659 source lines. It had 3 CI workflow files and a tests directory, but no Dockerfile. The build excerpt only shows an ESM loader stack ending at ModuleJob.run, then reports Node.js v18.20.8. The test excerpt shows cases 45 through 56 passing, not the 8 failures. Neither excerpt tells us why the commands failed, so assigning a cause would be guesswork.

Setup reaches Cloudflare and every watched host

Local development requires Node 18+, npm, and Wrangler 4. A hosted setup also needs a Cloudflare account, a GitHub account, a D1 database, and an API_SECRET. The recommended paths either connect a fork directly to Workers or deploy through GitHub Actions. The Actions route adds a Cloudflare API token, account ID, and D1 database ID to the repository's secrets.

After the Worker is live, you sign in at /admin#/admin, add each server, and run its generated install command. The initial admin password is the same API_SECRET used by agents, although the password can be separated later. Changing API_SECRET requires redeploying the Worker and updating every agent. That is manageable for 6 personal servers and irritating for 60, so settle the secret before enrolling the fleet.

The free tier is designed around roughly 60 servers

The project estimates roughly 60 servers at the default 60-second report interval. A 120-second interval can theoretically double that number, but the README does not present it as a capacity guarantee. Shorter intervals create more Worker requests and D1 writes. A buyer with hundreds of machines should price and load-test the actual Cloudflare account instead of treating the free tier as an unlimited monitoring backend.

Retention has similar limits. The main feature table promises 7-day history and sampled long-range views, while issue 108 asks about displaying a month or more. The repository also has cron jobs every 1 minute and every hour for alerts, rotation, cleanup, and expiry checks. This is a good fit for current-state visibility and short investigations, not an obvious replacement for a metrics warehouse kept for years.

September activity is high, but releases are informal

On September 28, 2026, GitHub listed 2,296 stars, 2,146 forks, and 5 open issues and pull requests. The open set contained 3 issues and 2 pull requests, and the repository had been pushed that same day. Issue 109, opened that day, describes a refresh loop after a Cloudflare Access callback to the private admin route. Those dates show active maintenance and an active defect queue.

The panel repository has no GitHub Releases entry, even though its README identifies the current line as v2.8.6. Operators therefore follow the branch, version file, and separate agent releases rather than one panel release artifact. The maintainer's stated scope is now mainly bug fixes and interface work, with feature requests accepted only when they do not add much complexity, security risk, or load. That restraint suits this project better than endless feature growth.

CF-Server-Monitor deserves a sandbox trial if Cloudflare is already part of your stack and an outbound-only agent is the priority. Our failed 4-second build and 8 failed tests keep it out of the set-and-forget category today. Prove the build, test private login, watch D1 usage, and only then install the agent across the rest of the fleet.

Alternatives

ProjectWhat it isPick it when
Beszel gh↗A compact server-monitoring hub and agent with a conventional self-hosted control plane.pick this instead when you want the monitoring hub on your own machine rather than on Cloudflare services.
Uptime Kuma gh↗A self-hosted uptime dashboard centered on service, port, and endpoint checks.pick this instead when external availability checks matter more than detailed host metrics.
NezhaAn agent-based multi-server dashboard with a server-hosted controller.pick this instead when you want a traditional controller and are comfortable operating it yourself.

What people are saying

  1. [github-trending] huilang-me/CF-Server-Monitor

Sources

  1. CF-Server-Monitor English README
  2. CF-Server-Monitor repository
  3. Cloudflare Access admin refresh-loop issue
  4. Maintainer scope statement
  5. Longer history request

More self-hosted reviews

niubigeo · kuboard-press · taskview-community · dae · yuvomi · mlmvpn_windows · the whole board →